
Monitoring .Net Core Application with Prometheus on Azure AKS
Kubernetes is a powerful system to build, operate and grow a cloud native architecture. To stay on top of what’s happening across your pods that are dynamically scheduled we need a system capable of monitoring the entire stack while enabling users to drill down from a global view to individual instances.
When deploying applications in Kubernetes we should setup a proper instrumentation to gather insights and solve general monitoring needs.
1. Introduction
![]()
Prometheus has become the defacto monitoring and alerting system for cloud native applications with systems like Kubernetes natively exposing Prometheus metrics. It’s an open-source metric monitoring solution and time series database that is part of the Cloud Native Computing Foundation (CNCF).
The Prometheus selling points are:
- efficient and simple to operate
- works well for monitoring dynamic environments since it integrates with different kinds of service discovery
- powerful query language
- designed with microservices and distributed architecture in mind
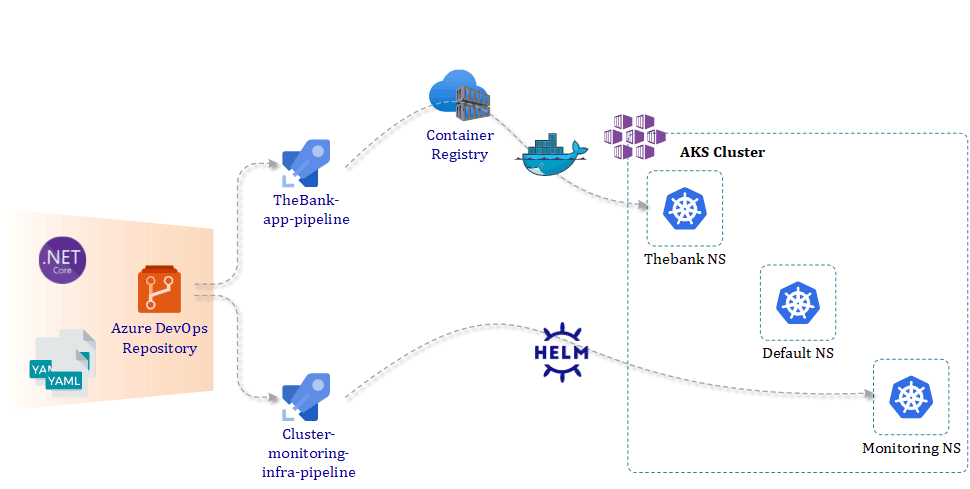
The image below gives you an idea of what we will build today.
2. Create .NET Core Application
To experience the capabilities of Prometheus we need to use it in combination with an application. We are going to create a .NET Core application and setup Prometheus scraping a custom metric. The application and Prometheus will be running as a container inside an Azure AKS cluster.
From VSCode we create our new .NET Core application “the bank”.
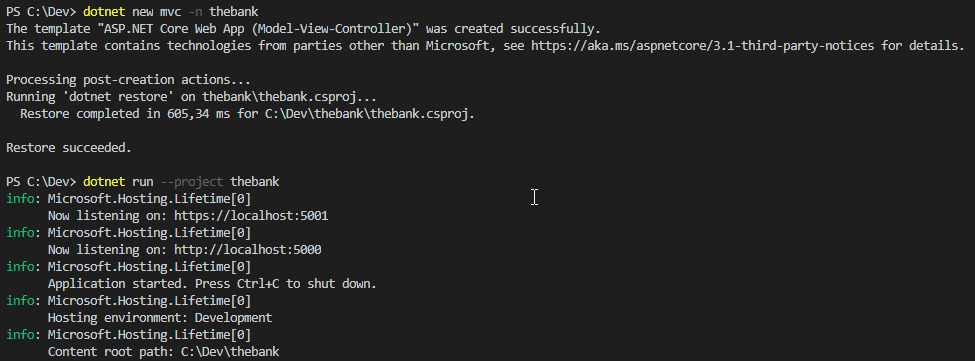
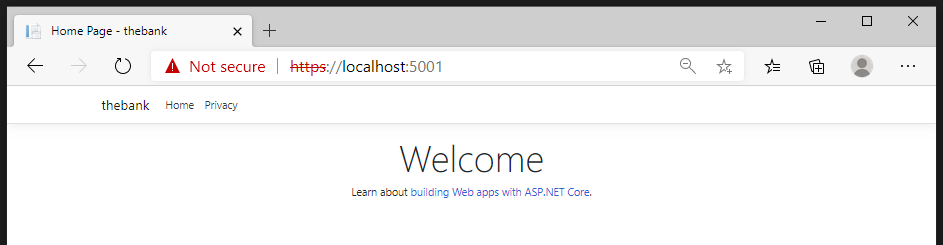
When we run the application we can view the default .NET Core application homepage.
2.1 Add .NET Core Prometheus library
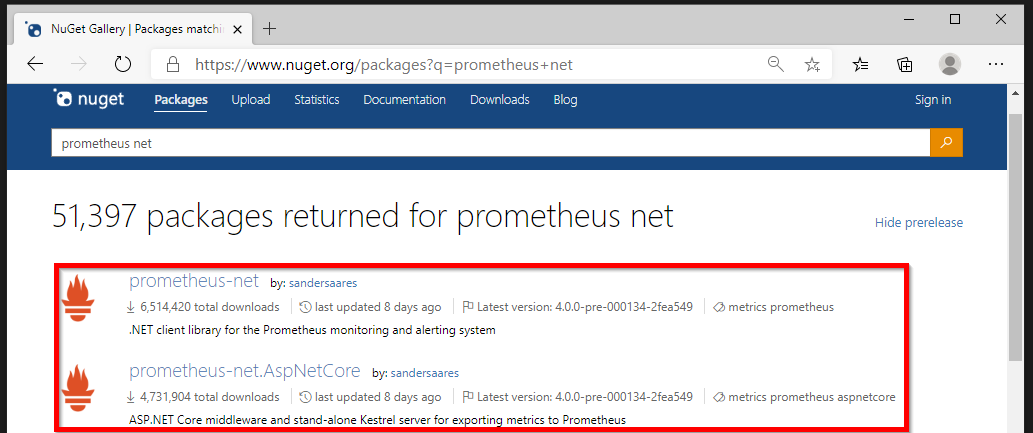
Now that we have our application running we need to add the Prometheus .NET client libraries. These can be found on the nuget website.
We use the commands below to add the two client libraries to our application.
dotnet add package prometheus-net --version 4.0.0-pre-000134-2fea549
dotnet add package prometheus-net.AspNetCore --version 4.0.0-pre-000134-2fea549
After we added both packages, we can view them in the configuration file of our application (thebank.csproj).
At this point we can start exporting our application metrics. This is done from the Startup.cs class.
To enable the .NET Core Prometheus packages we added before, we add the following line at the top of the file.
using Prometheus;
Next, we are going to add a method which is made available through the .NET Core Prometheus package. This will expose the Prometheus metrics on the /metrics URL. Add endpoints.MapMetrics() to the endpoint configuration inside app.UseEndpoints.
public void Configure(IApplicationBuilder app, ...)
{
    app.UseEndpoints(endpoints =>
    {
        // ...
        endpoints.MapMetrics();
    })
}
If we run the application again, we can right away view the metrics page.
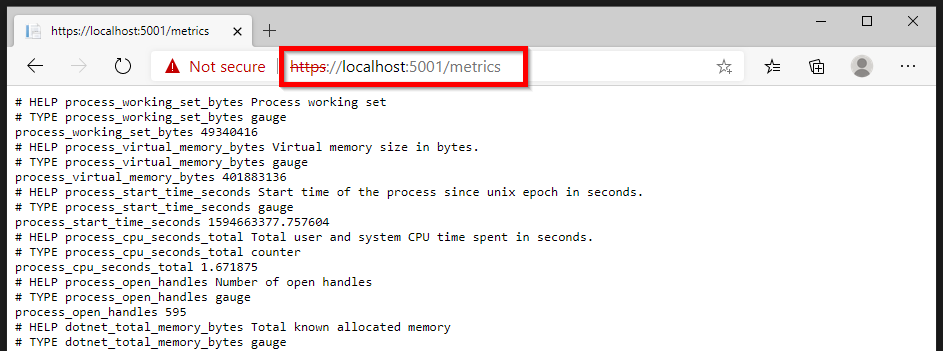
These metrics are out-of-the-box available through the usage of the nuget packages. We will now extend the metrics with a custom counter which will count the views of our webpage.
Below you can view the changes we have made to the file Controllers>HomeControllers.cs.
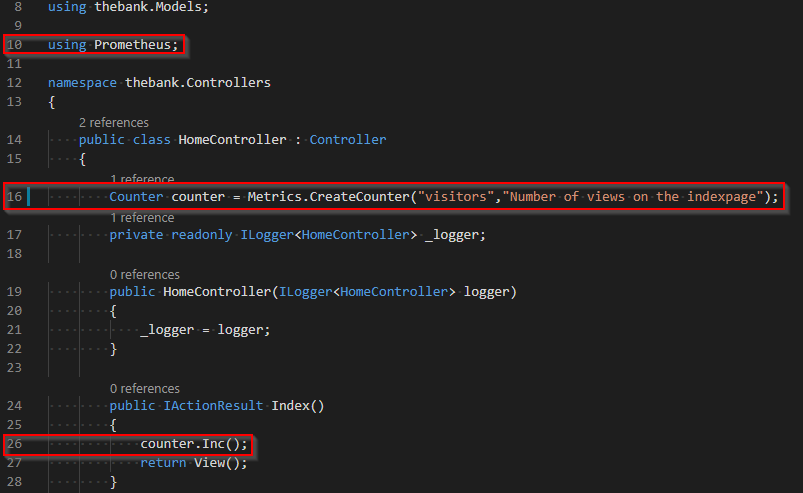
- line 10: We add the Prometheus .NET client library.
- line 16: The custom counter has a name and description which will be visible on the metrics page.
- line 26: Each time we have a new visitor on our index page we want to increase the value of our custom counter.
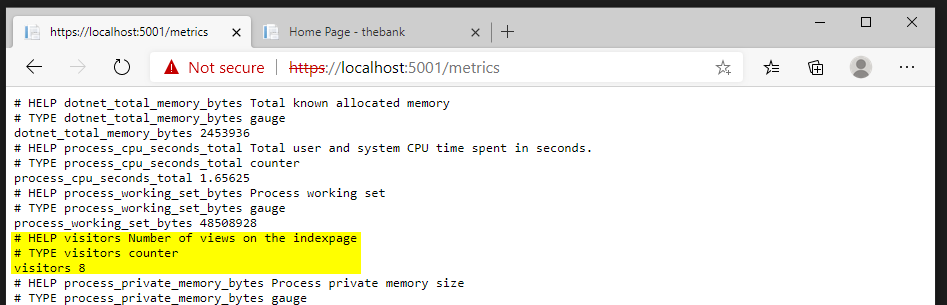
That’s all what is necessary to configure a custom counter. If we run the application again, we will be able to track the visitor counts.
In the next sections we will containerize our application and deploy it on the Azure AKS cluster. Eventually we want Prometheus to scrape the metrics of our .NET Core application.
3. Create Docker container image
In our code-repository, you will find the Dockerfile in the folder thebank. We are using a multi-stage Dockerfile. In the first stage we use the SDK image to build and publish our application. This image contains more tooling and is therefor larger than the ASP.NET Core image. The 3.1-buster-slim tag indicates two things:
- 3.1 defines that the images is running .NET Core 3.1
- buster-slim refers to the Debian Linux variant the image is running
4. Setup Azure DevOps pipeline
Via an Azure DevOps pipeline we will automate the build and push process of the docker container to an Azure Container Registry. Besides that we also want to deploy our application in our Azure AKS cluster and install Prometheus using Helm.
Helm is a package manager that provides the tools to find, share, install and manage software in Kubernetes.
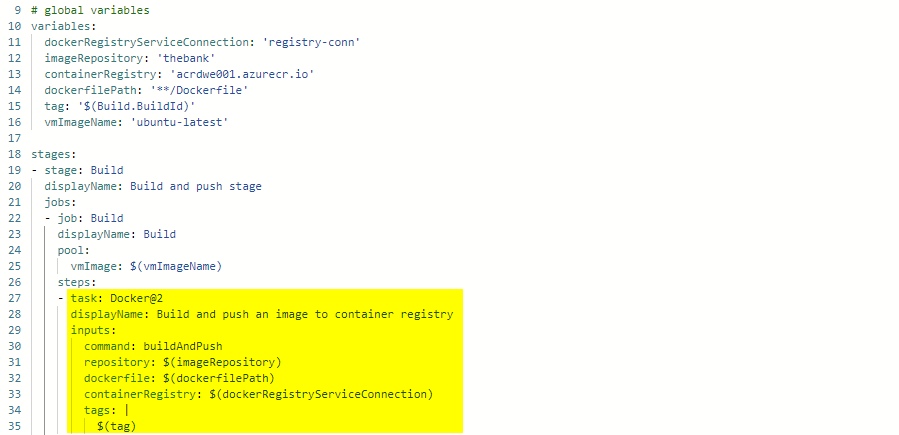
4.1 Build & push to container registry
Our first Azure DevOps pipeline 1-thebank-app-pipeline.yml will build and push the container image to our Azure Container Registry. First we create our Azure AKS cluster and Azure Container Registry with Terraform like we described in our previous post Deploying Azure Kubernetes clusters with Terraform and Azure DevOps pipelines.
The Docker@2 task below, combines the build and push action.
4.2 Kubernetes deployment manifest .NET Core App
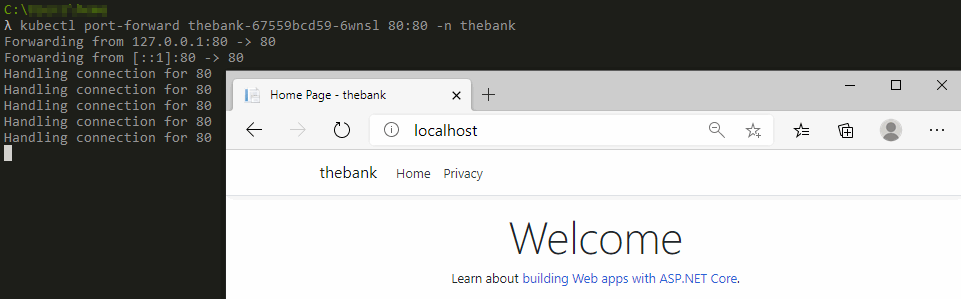
The folder manifests in the root directory of our Azure DevOps project contains our Kubernetes configuration files. Because we have not exposed our .NET Core application to the public internet we can only verify our application from our workstation by using port-forwarding.
# Get access to the Azure AKS cluster
az aks get-credentials --resource-group <aks_resource_group> --name <aks_cluster_name>

# Setup port-forwarding to our application POD on port 80
kubectl port-forward <pod-name> 80:80 --namespace <application_namespace>
4.3 Kubernetes deployment Prometheus
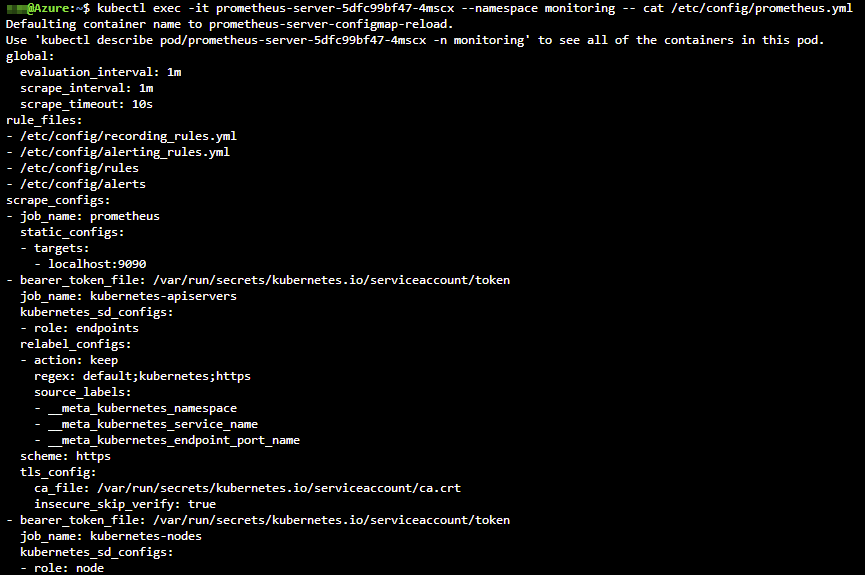
Our second Azure DevOps pipeline 2-cluster-monitoring-infra-pipeline.yml instructs the deployment of Prometheus via Helm. The Prometheus Helm chart contains a default server configuration that we can view using the following command:
# Exec into our Prometheus server container and display the prometheus.yml file
kubectl exec -it <prometheus_pod> --namespace <monitoring_namespace> -- cat /etc/config/prometheus.yml
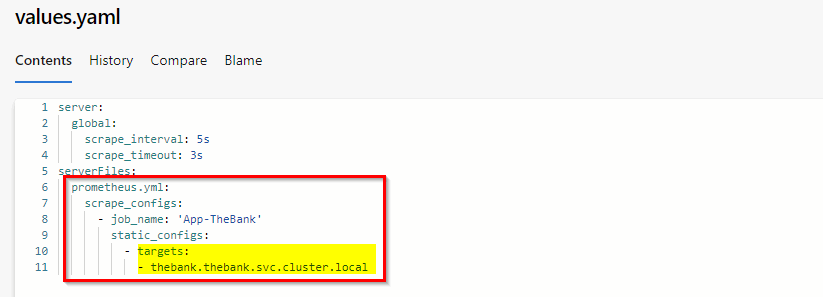
We want to keep the existing configuration but also make the necessary changes to scrape the metrics of our thebank .NET Core application. By customizing aspects of the deployment we override specific values which are defined in a values.yaml file.
In the scrape_configs section we add an additional job for our .NET Core application. Prometheus and our application are living in separate namespaces. If we add the service endpoint of our application we need to use the full cluster DNS name (<servicename>.<namespaces>.svc.cluster.local) for discovery.
5. Verify custom metric
When we browse to the Prometheus homepage (using kubectl port-forward) and click in the menu Status>Configuration we can view the Prometheus configuration file which was build based on our Helm values.yaml file.
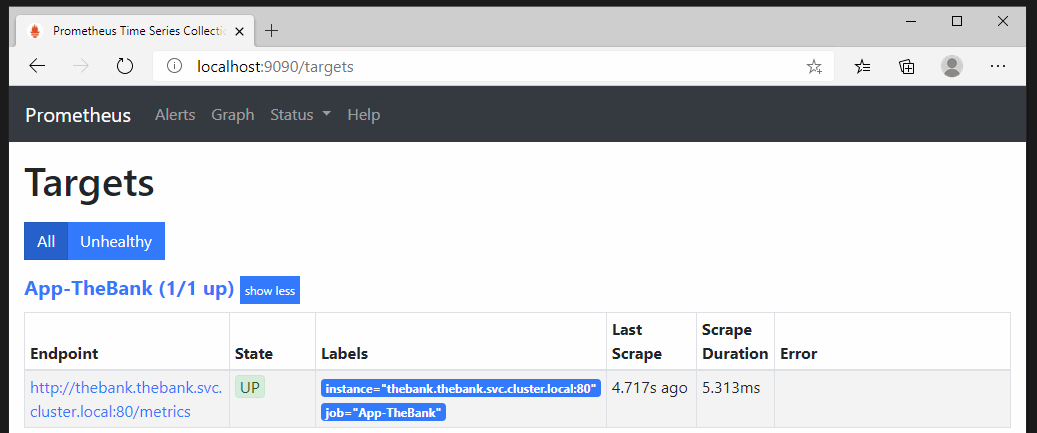
If we take a look from the Prometheus homepage at Status>Targets, we can see our application endpoint, state, labels, last scrape, scrape duration and errors.
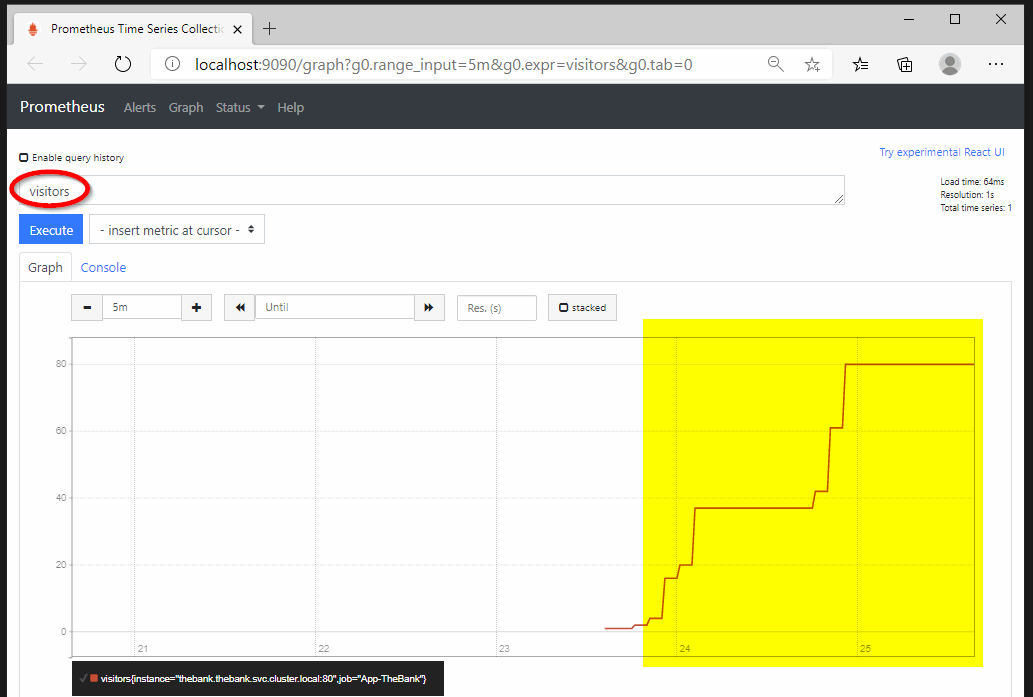
In the PromQL query field, we can search for our custom counter visitors. If we hit our application page multiple times, we will see a spike in the graph.
This completes our implementation of a custom .NET Core counter using Prometheus.
The configuration we used in this post can be found on https://github.com/dewolfs/dotnetcore-prometheus.