
Monitoring .NET Core application with Elastic on Azure AKS
While Kubernetes can dramatically simplify the task of application deployment in containers, its dynamic nature adds new complexity to monitoring the services and applications running in it, as well as, the health of the containers and orchestration infrastructure itself.
In correlation with the fast paced technological evolution, software applications have also evolved to become more complex, more distributed and more dynamic. Cloud computing has pushed this evolution a step further. Therefore it is now more difficult to properly monitor application performances and ensure the end user that he will get the high-quality experience he is expecting.
The recent technological improvements have make it really difficult to properly monitor application performances.
1. Introduction
Elastic Stack is a powerful popular open source platform for search, logging, and analytics.

Elastic Cloud for Kubernetes (ECK) eliminates the need to invoke an instance of the platform running outside a Kubernetes environment. ECK provides DevOps teams access to logs, metrics and application performance management (APM) capabilities along with security information event management (SIEM), machine learning and lifecycle management tools. Elastic is making available a free-forever Basic tier instance of ECK.
Elastic Cloud for Kubernetes (ECK) is the preferred way to run the Elastic stack on Kubernetes, with a focus on enabling “day 2” operations.
We will go through the steps how to instrument an .NET Core application to ship performance metrics to Elsticsearch in order to visualise them with Kibana’s pre-configured dashboards. We can analyse user requests from the invocation sequence and detect the root causes of potential problems.
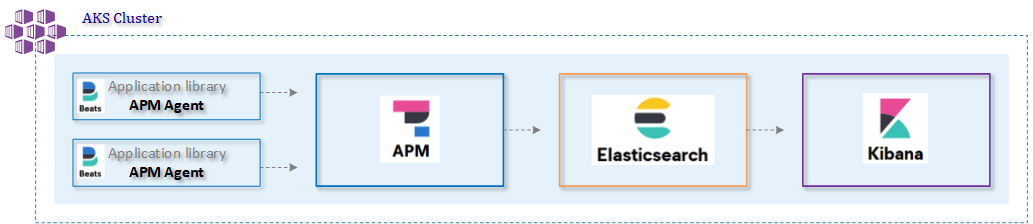
The image below gives an overview of what we will implement today.
2. Installation Elastic Cloud for Kubernetes
2.1 Infrastructure
We first start with the deployment of our infrastructure using an Azure DevOps pipeline 1-infra-aks-pipeline.yml which makes use of the Bicep modules we have discussed in a previous blogpost.
2.2 Kubernetes Operator
Once we have the infrastructure up and running we can start with the installation of the required Elastic components. This will be executed via the ECK Kubernetes operator. The operator helps us to automate the deployment, management and upgrade of Elasticsearch, Kibana, APMServer and Beats.
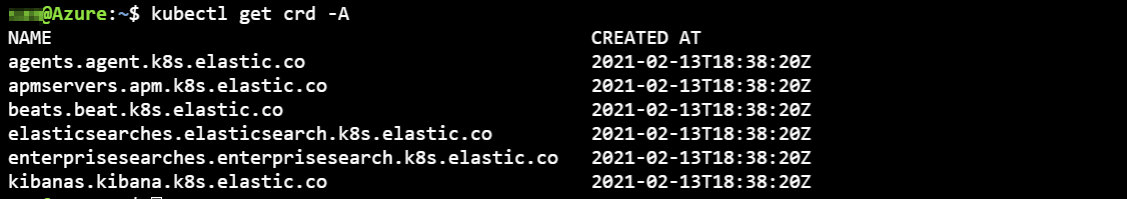
In the first stage of our Azure DevOps pipeline 2-eck-pipeline.yml, we install the Operator. After this step we make use of the Kubernetes custom resource definitions (CRDs) to define the Elastic objects in simple configuration files.
We can now verify which crd’s are at our disposal after the installation of the Operator.
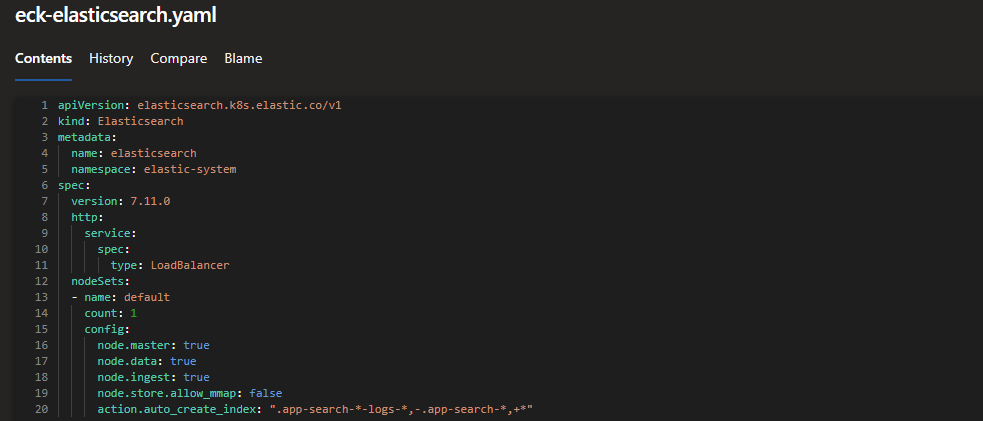
For each of the Elastic components we have created a Kubernetes manifest file. You can find back the manifest file in the Github repo under the folder manifests.
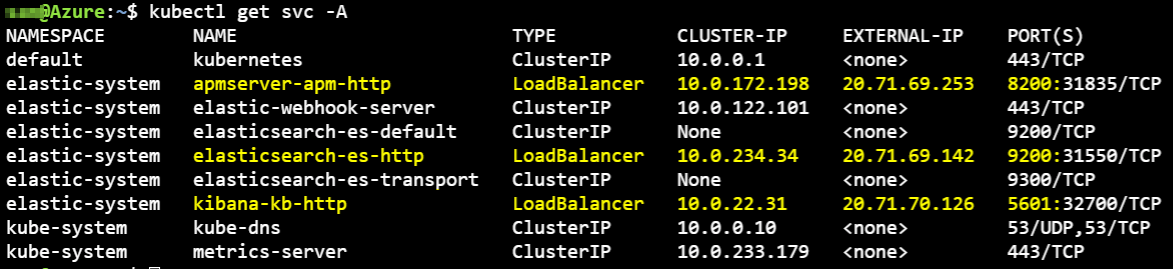
After the successful run of our pipeline, we can view the result of the created Kubernetes services of our Elastic components.
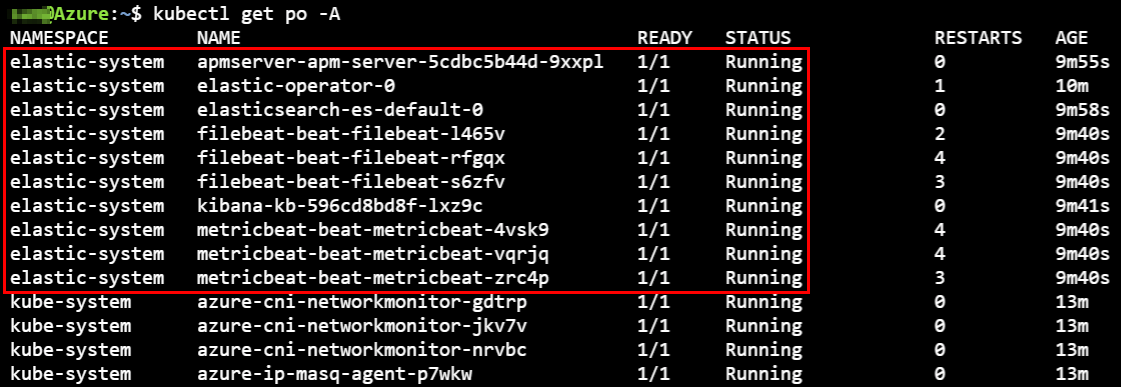
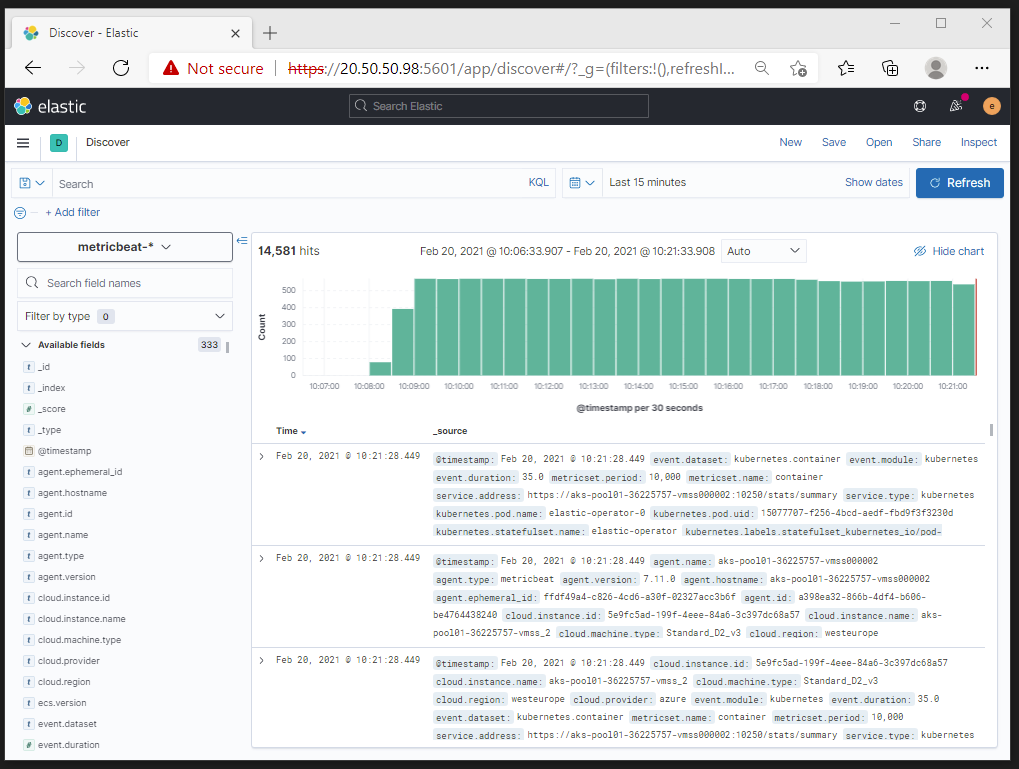
Inside the elastic-system namespace, we can view the Kubernetes Elastic pods. The Filebeat and Metricbeat pods are running as a daemonset on each of the AKS worker nodes.
To login to the Kibana portal, we need to get the auto-generated password. Execute the following command to retrieve it and access the portal with the username elastic.
kubectl get secret elasticsearch-es-elastic-user -n elastic-system -o go-template='{{.data.elastic | base64decode}}'
3. Application Performance Monitoring
We are going to create a .NET Core application and setup application performance monitoring (APM) to Elastic. The application and the Elastic components will be running as a container inside an Azure AKS cluster.
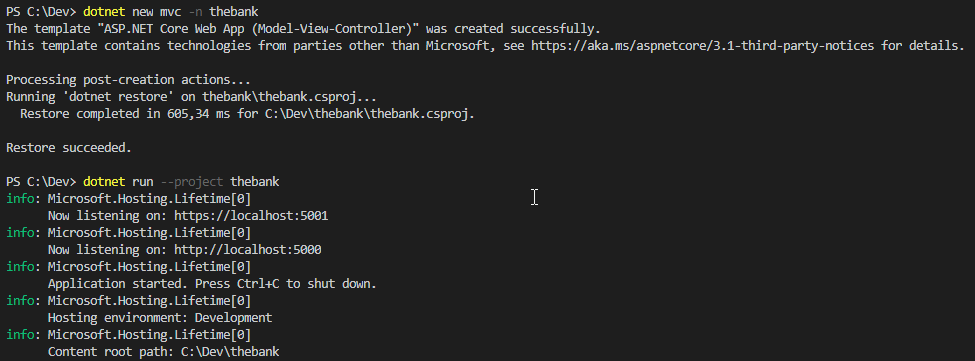
From VSCode we create our new .NET Core application “the bank”.
3.1 Install nuget package
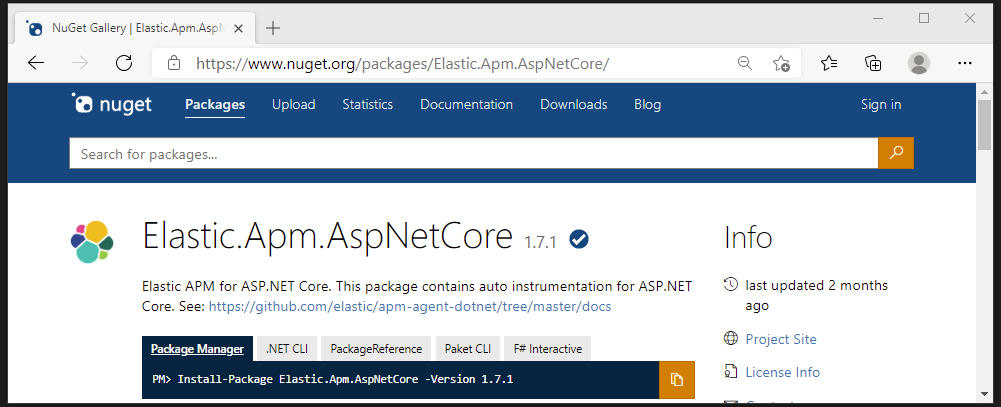
To be able to send telemetry data of our application to Elastic, we first install the Elastic Nuget package.
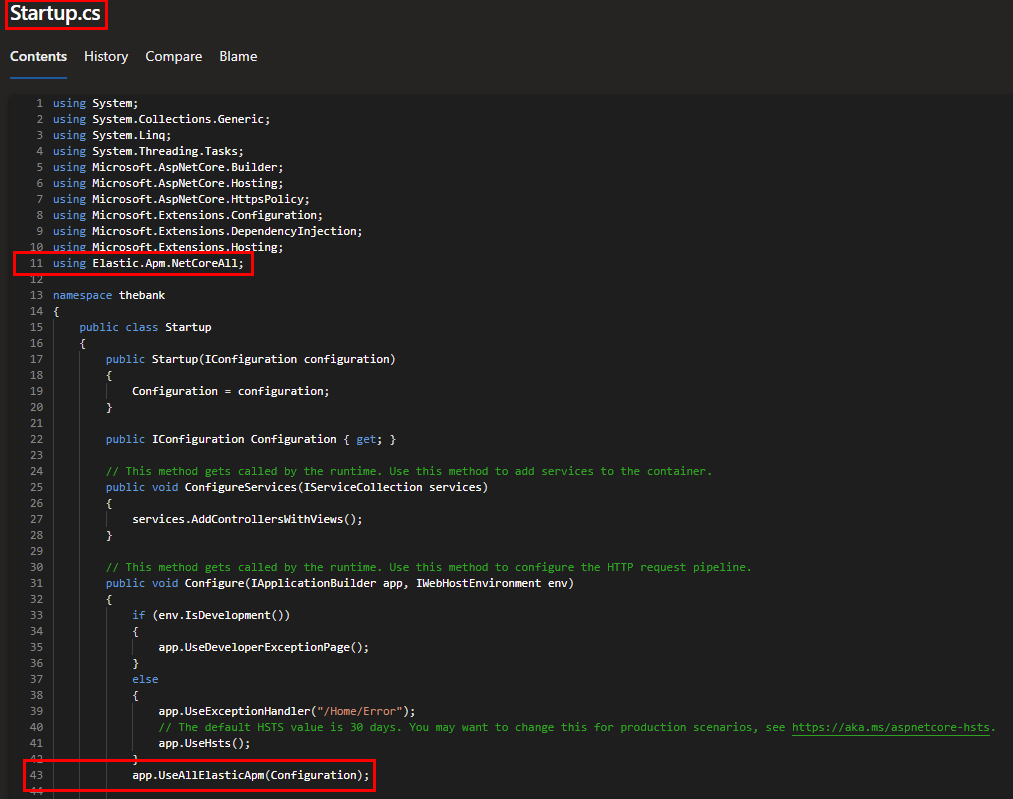
3.2 Update startup.cs
As a second step, we are going to make the necessary changes to our application to make use of the package and tell it to send the data to our Elastic APM server. The following changes are made to the startup.cs file of our application:
- Line 11: reference to the nuget Elastic package
- Line 43: add the method UseAllElasticApm()
3.3 Adjust appsettings.json
In the appsettings.json file we make the following changes:
- Add elastic.apm to loglevel
- Add the apmserver url (Kubernetes service external IP) with secretToken and name of our application
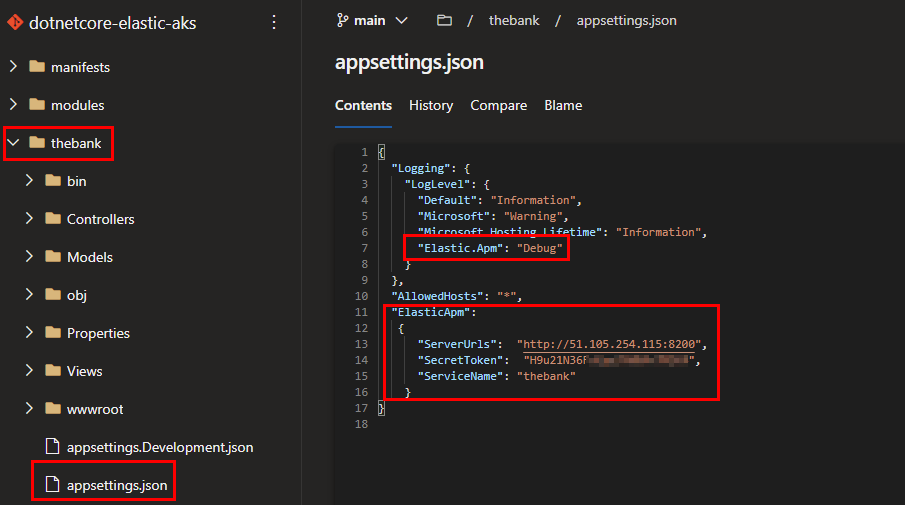
The secretToken of the Elastic APM server can be found as a secret in Kubernetes. Use the following command to get it.
kubectl get secret/apmserver-apm-token -n elastic-system -o go-template='{{index .data "secret-token" | base64decode}}'
4. Application deployment
4.1 Build & push to container registry
The last step is defined in our Azure DevOps pipeline 3-thebank-app-pipeline.yml, where we will build the docker image, push it to the Azure Container Registry and deploy it to our AKS cluster.
4.2 Kubernetes deployment manifest .NET Core App
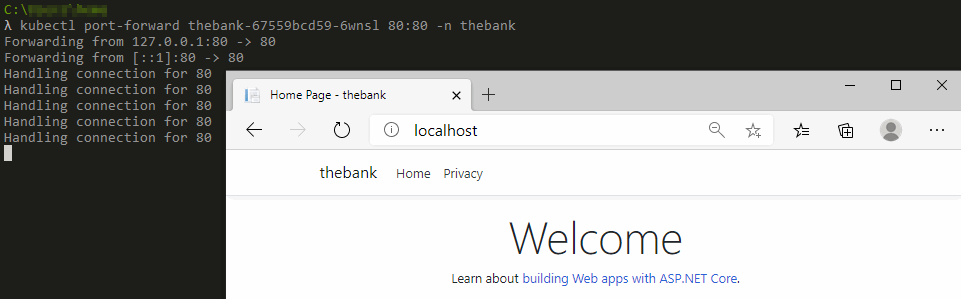
The folder manifests in the root directory of our Azure DevOps project contains our Kubernetes configuration files. Because we have not exposed our .NET Core application to the public internet we can only verify our application from our workstation by using port-forwarding.
kubectl port-forward <pod-name> 80:80 --namespace <application_namespace>
5. Results
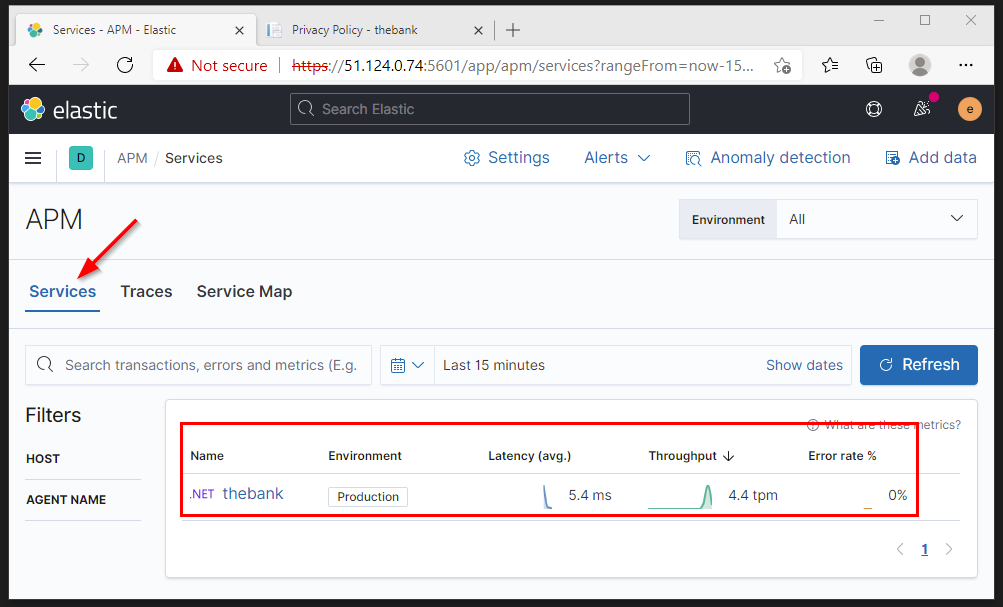
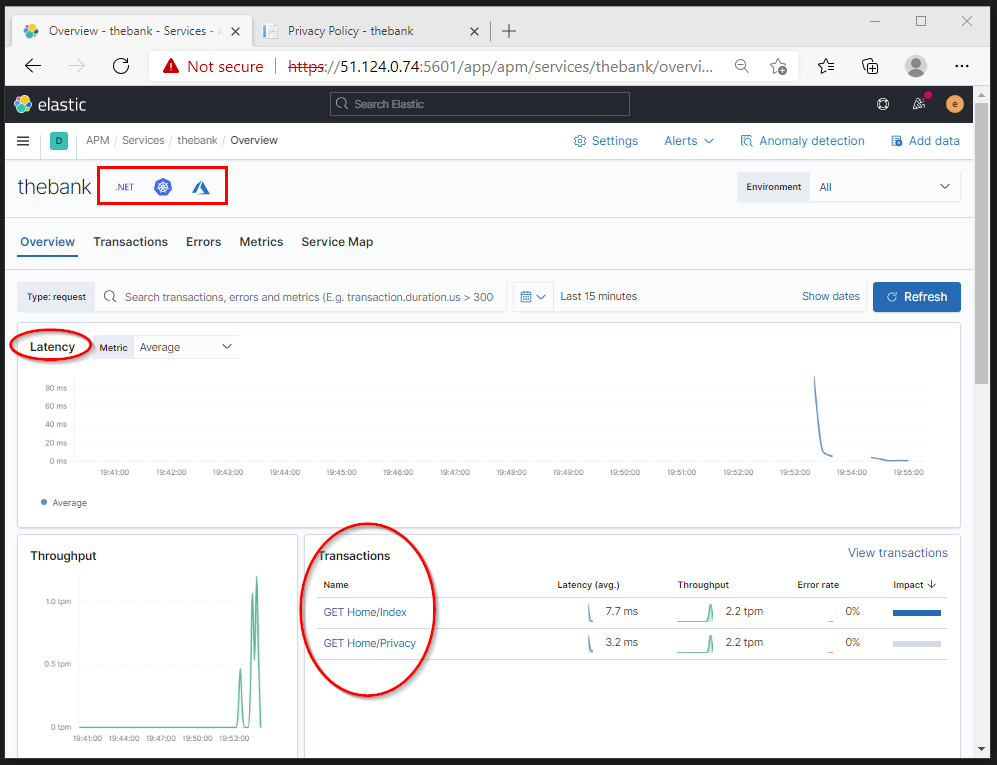
In the APM section of the Kibana portal, we can now view our application with some base metrics (latency, throughput, error rate %).
The Elastic .NET agent recognizes that the application is running inside a Kubernetes cluster on Microsoft Azure.
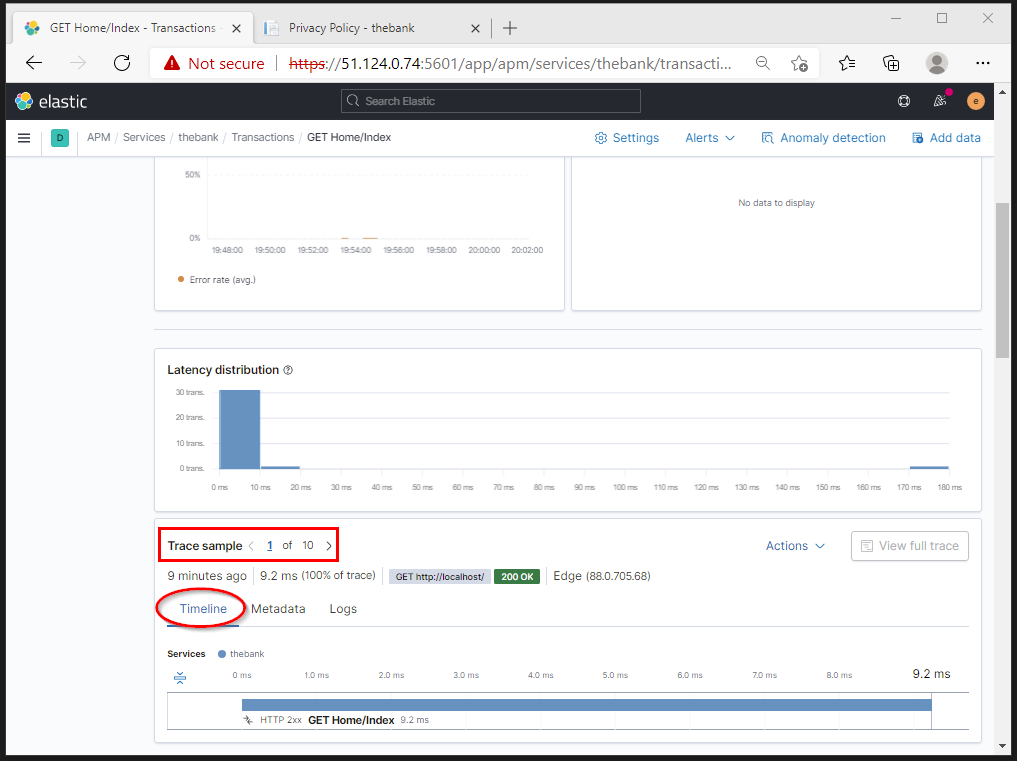
After accessing different parts of our demo .NET Core application we can view the metrics per transaction.
The timeline is making clear how long the specific part of our application took to load.
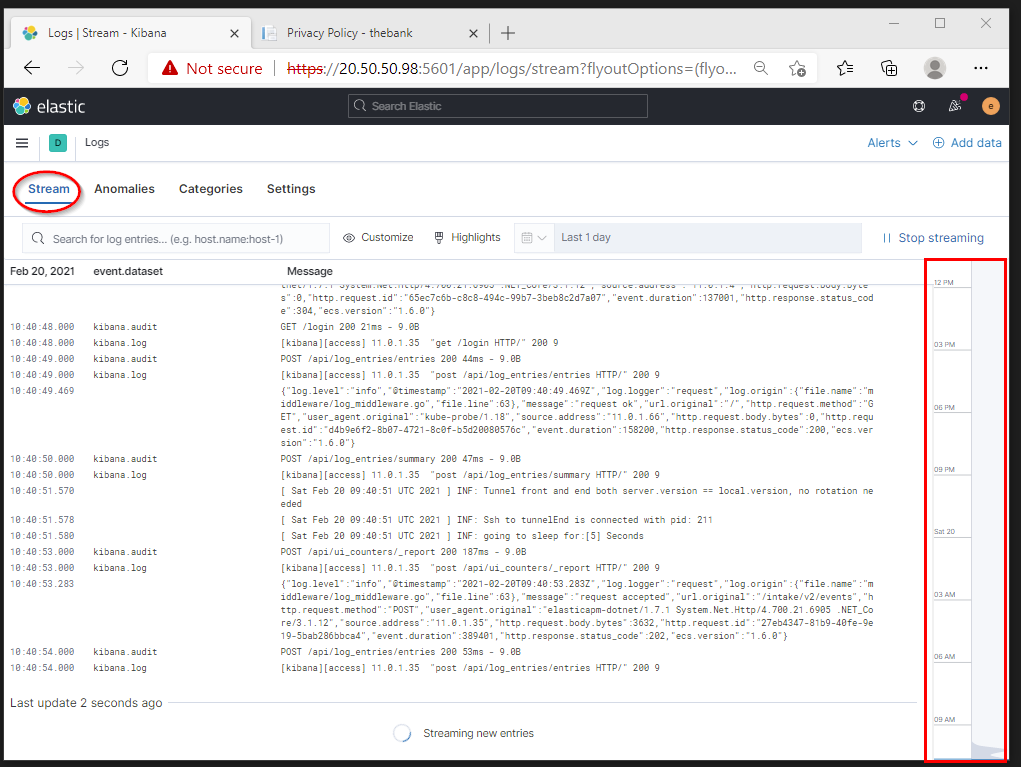
The stream page enables us to view all of the log events flowing in from the containers in a centralized view.
6. Troubleshooting
6.1 Check Elastic APMServer logs
Make sure that the APMServer is up and running without any errors. You can verify the APM server container log.
kubectl logs <apm-pod-name> --namespace elastic-system
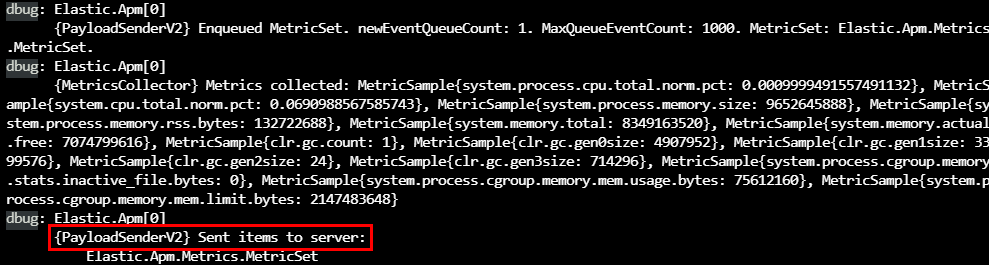
6.2. Verify your application container log
The log file of your application should contain information about sending data to the Elastic APM server.
If you see errors in this log file, it is most likely linked to unable to access the APM server. Verify by using the following command.
curl http://<ip-apmserver>:8200 -i
The result should be a 200 OK.
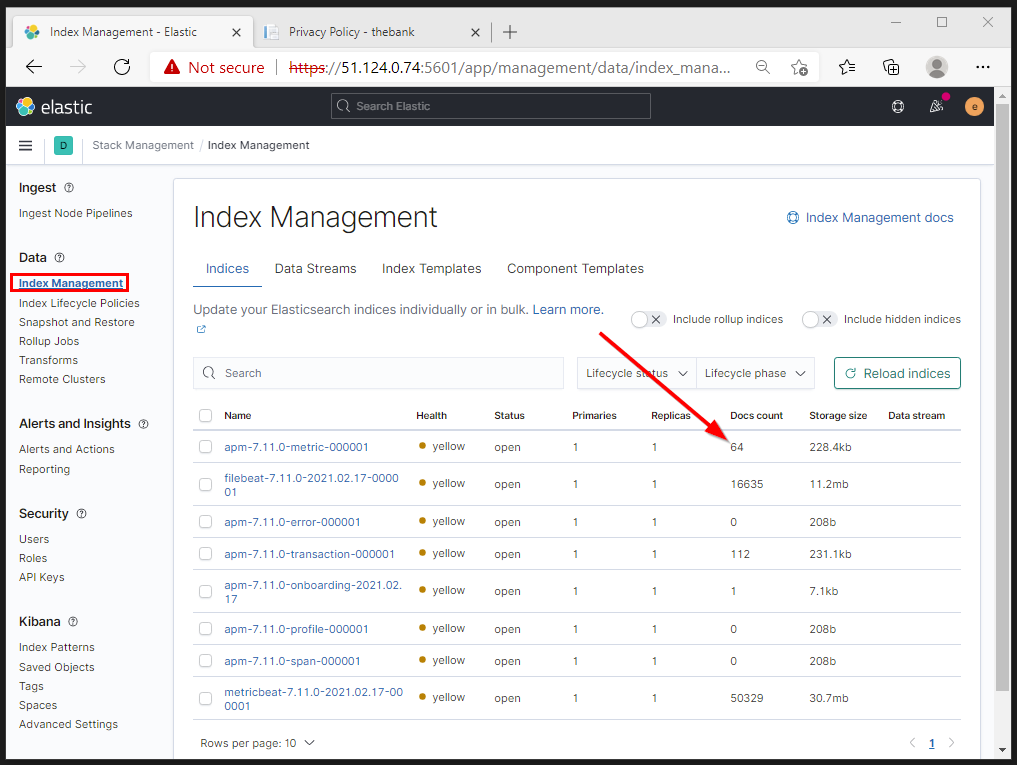
6.3. Elastic APM Index
Verify that the APM Index has been automatically created and contains documents.
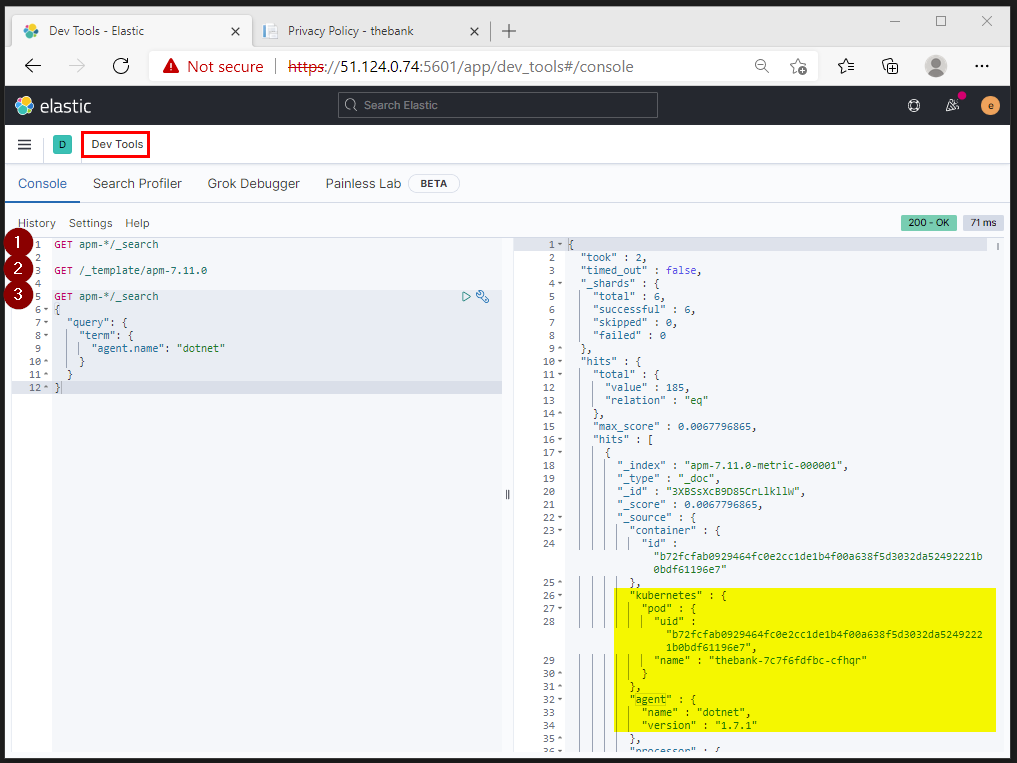
6.4. APM API calls
From the Kibana portal, you can execute API calls targetting the APMServer endpoints to verify document content.
The configuration we used in this post can be found on https://GitHub.com/dewolfs/dotnetcore-elastic-aks.