
Managing multi-AKS-cluster deployments with GitOps and ArgoCD
Many organizations are discovering the advantages of using ArgoCD and a GitOps workflows to manage their Kubernetes clusters, with Git repositories as the source of truth for defining the desired application state, and ArgoCD responsible for keeping the cluster synchronized with those repositories.
However, managing deployments of large numbers of applications/clusters with ArgoCD requires complex custom scripting to keep those applications in sync.
The ArgoCD ApplicationSet controller aims to solve this problem, by working alongside ArgoCD to automatically generate Application deployments using templates and parameterization: manage multiple Kubernetes clusters at once, deploy large numbers of applications from multiples respositories, and more.
1. Introduction
GitOps is a pattern for managing the state of Kubernetes clusters using git as the source of truth. The entire state of the cluster is declared in manifests stored in git repositories and any changes to the manifests follow well-known git processes. Once the manifests are version controlled in git, then there’s a number of state reconcilers (Flux, ArgoCD and the like) that can automatically apply changes from the repository.
![]() Kustomize is a tool for customizing manifests of Kubernetes application in a declarative way. Managing configuration in Kubernetes is a common task and usually quite challenging as the application scales up. Numerous tools have been developed, but seldom leverages the power of native Kubernetes APIs.
Kustomize is a tool for customizing manifests of Kubernetes application in a declarative way. Managing configuration in Kubernetes is a common task and usually quite challenging as the application scales up. Numerous tools have been developed, but seldom leverages the power of native Kubernetes APIs.
 ArgoCD extends the benefits of declarative specifications and Git-based configuration management to accelerate deployment and lifecycle management of applications without compromising security and compliance.
ArgoCD is a declarative, GitOps continuous delivery tool for Kubernetes.
ArgoCD extends the benefits of declarative specifications and Git-based configuration management to accelerate deployment and lifecycle management of applications without compromising security and compliance.
ArgoCD is a declarative, GitOps continuous delivery tool for Kubernetes.
The CNCF Argo Project is now in production with hundreds of companies across numerous verticals and geographic regions.
This blogpost will describe how to use use ArgoCD and Argo ApplicationSets with the following capabilities:
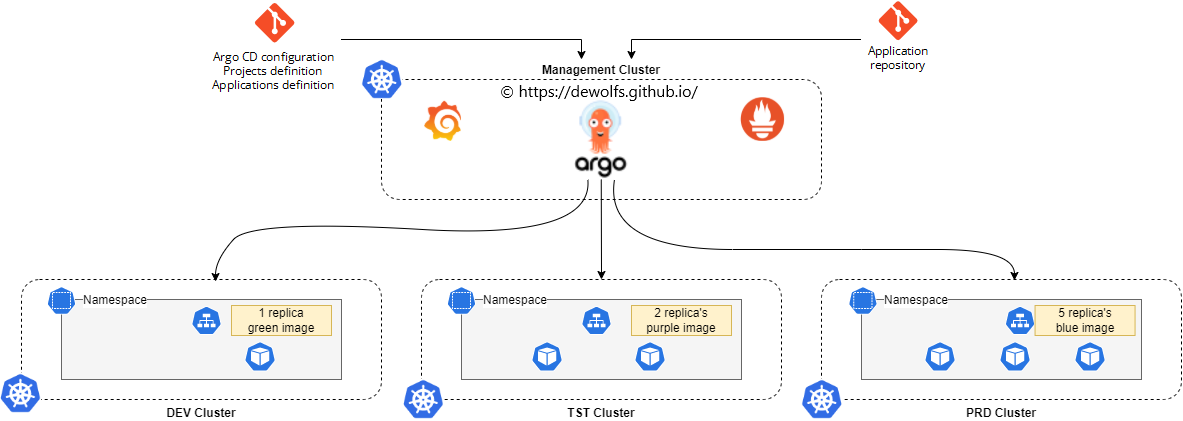
- Deploy and manage an application over a large fleet of Kubernetes clusters to iterate faster on changes
- We’ll show you how to reduce risk and seamlessly roll out an application by using a phased approach (per cluster, environment)
- Deploy a monitoring system (prometheus & grafana) as a logical app to keep track of you GitOps environment
2. Infrastructure Provisioning
We deploy 4 Azure Kubernetes clusters. The provisioning of the AKS clusters is executed via GitHub Actions using the Azure CLI. Make sure to have access to all 4 clusters because we will manage them from our Kubernetes management cluster.
az login
az aks get-credentials --name aks-mgt-001 --resource-group rg-mgt-001 --overwrite-existing
az aks get-credentials --name aks-dev-001 --resource-group rg-dev-001 --overwrite-existing
az aks get-credentials --name aks-tst-001 --resource-group rg-tst-001 --overwrite-existing
az aks get-credentials --name aks-prd-001 --resource-group rg-prd-001 --overwrite-existing

kubectl config use-context aks-mgt-001
kubectl config get-contexts
3. ArgoCD
3.1 ArgoCD Installation
The installation of ArgoCD is straightforward via the command below.
kubectl create namespace argocd
kubectl apply -n argocd -f https://raw.githubusercontent.com/argoproj/argo-cd/stable/manifests/install.yaml

kubectl port-forward svc/argocd-server -n argocd 8080:443

kubectl -n argocd get secret argocd-initial-admin-secret -o jsonpath="{.data.password}" | base64 -d
Once completed we can access the ArgoCD portal using port-forwarding. The password to login is stored as a secret in Kubernetes.
3.2 Add Clusters
Now we are going to add the DEV, TST & PRD Kubernetes clusters to ArgoCD. This can only be done via the ArgoCD CLI using the following commands:
kubectl config use-context aks-mgt-001
argocd login localhost:8080 --username admin --insecure

argocd cluster add aks-dev-001 --name dev
argocd cluster add aks-tst-001 --name tst
argocd cluster add aks-prd-001 --name prd
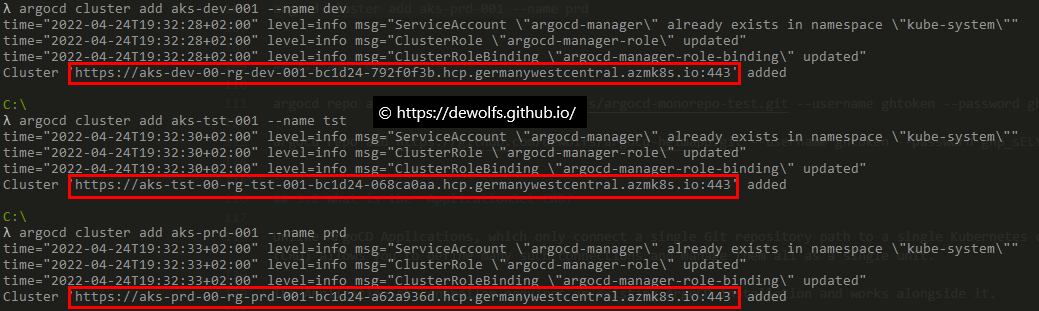
The output gives us the full cluster API address for each cluster. Keep them at hand, we will need them later.
3.3 Add Git Repository
ArgoCD deploys and manages Application Custom Resource Definition (CRD) objects which consist of manifests stored in Git repositories. We connect our GitHub repository to ArgoCD using a GitHub Token.
argocd repo add https://github.com/dewolfs/gitops-argocd-apps --username ghtoken --password <insert GitHub token>
3.4 What are ApplicationSets?
Unlike ArgoCD Applications, which only connect a single Git repository path to a single Kubernetes cluster namespace, the ApplicationSets Custom Resource Definition (CRD) allows you to define many such connections and manage them all as a single unit.
The ApplicationSet controller requires an existing ArgoCD installation and works alongside it.
The generators field (see image below) specifies a generator which is responsible for generating template parameters. Template parameters are key-value pairs that will be substituted into the template:
- cluster: dev
- url: https://aks-dev-00-rg-dev-001-bc…
–> The URL values are the full cluster API addresses which were the output when we added the clusters to ArgoCD.
The parameters are rendered into the corresponding fields of the template.
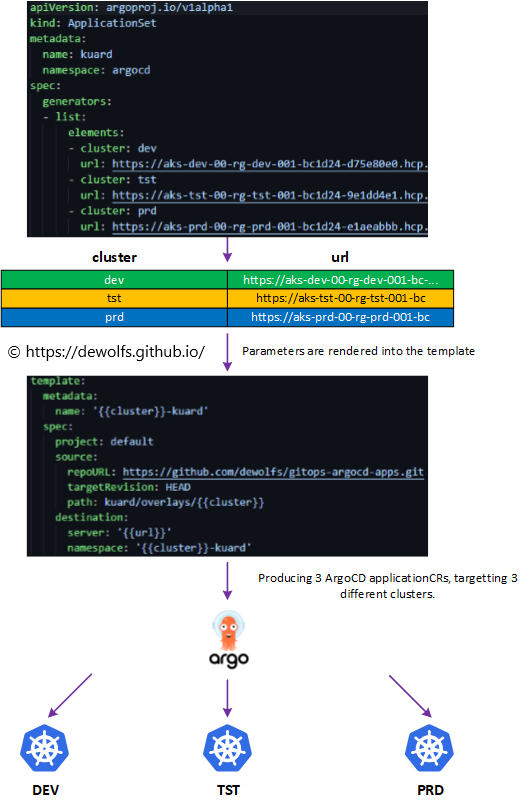
The template fields of the ApplicationSet spec are used to generate ArgoCD Application resouces. An ArgoCD Application is created by combining the parameters from the generator with fields of the template and from that a concrete Application resource is produced and applied to the cluster.
3.5 Execution to multiple environments at once
The initial deployment of the ApplicationSet is similar like native Kubernetes YAML deployments:
kubectl apply -f https://raw.githubusercontent.com/dewolfs/gitops-argocd-apps/main/applicationset-kuard.yaml -n argocd
The reconciliation ensures correctness and act on divergence. We can see that our ApplicationSet “Kuard” is deployed to all three Azure Kubernetes clusters.
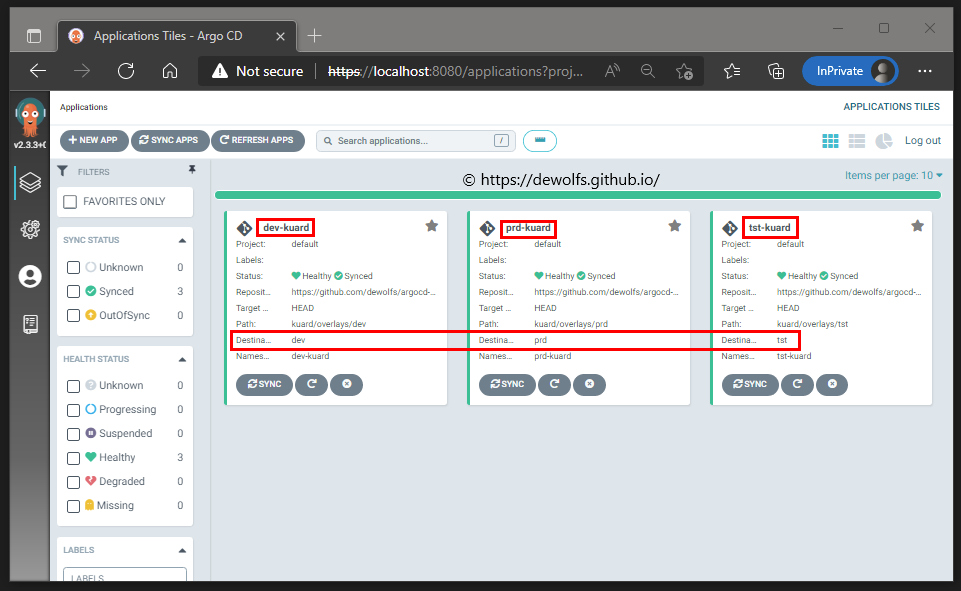
Do NOT use Git branches for modeling different environments. This is an anti-pattern we don’t want to do.
To model your GitOps environments use different folders on the same Git branch.
This is the Git directory structure we are using:
kuard
├── base
│   ├── kustomization.yaml
│   ├── service.yaml
│   └── deployment.yaml
└── overlays
    ├── dev
    │   └── kustomization.yaml
    ├── tst
    │   └── kustomization.yaml
    └── prd
        └── kustomization.yaml
The base directory holds configuration which is common to all environments.
We inherit all configuration from base. The important point here is the patches that we apply. The kustomization files are self-explanatory.
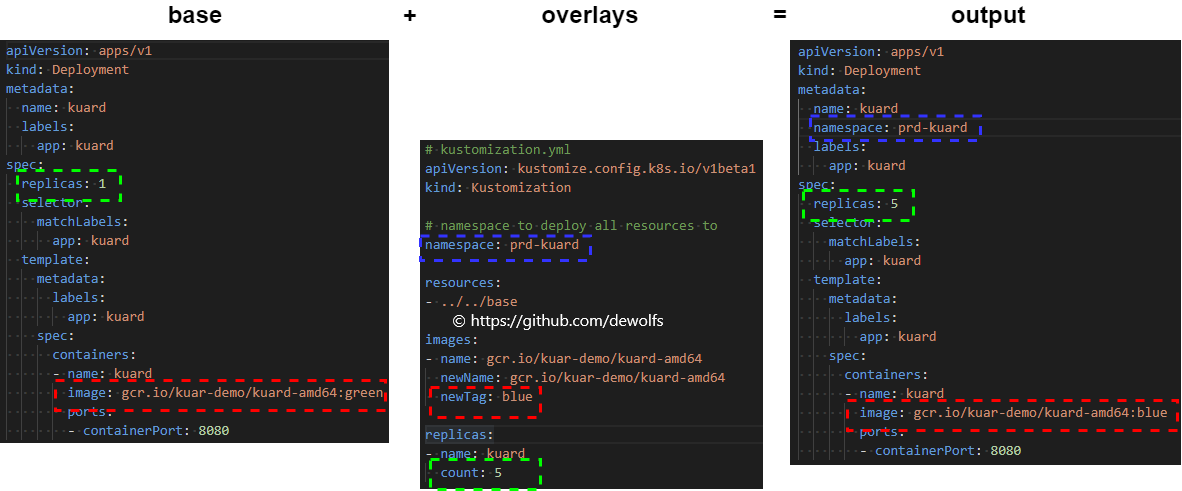
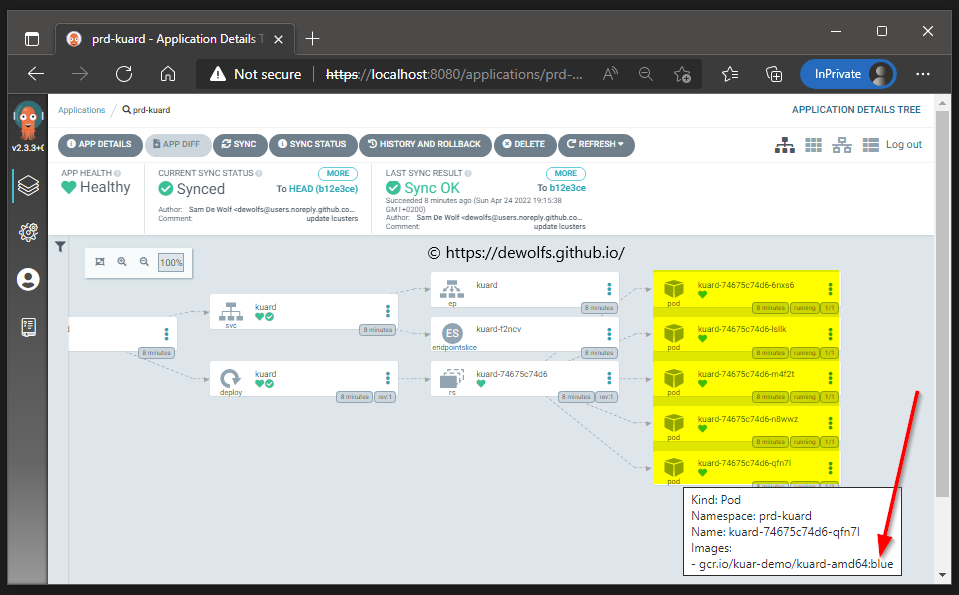
We want our Kuard application to run in production with the image tag blue and 5 Pod replica’s: prd-kustomization.yaml. Looking at the ArgoCD portal, we can indeed verify Kustomize merged the YAML files to the state we expect.
4. Monitoring
Keeping track of your ArgoCD applications can be done via the portal. However, if your number of clusters you need to manage is increasing you will need a single pane.
Luckly ArgoCD expose metrics which can be scraped by Prometheus. To visualize the ArgoCD metrics we will use a Grafana dashboard.
4.1 Metrics
If we take a look at the Kubernetes services, we can identify on which ports the ArgoCD services are exposing their metrics.
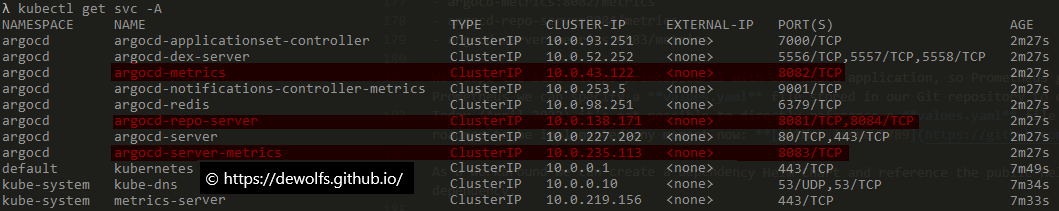
We adopt the same GitOps principles as with our Kuard application, so Prometheus gets deployed as an ArgoCD Application. If we use the public Helm Chart of Prometheus we can specify a values.yaml file stored in our Git repository to overwrite the default Prometheus configuration.
Today (April 2022) it’s not possible to directly reference a values.yaml file stored in a Git repository as part of our ArgoCD Application. This is on the roadmap to be implemented any moment now: GitHub issue 2789.
As a workaround we can create a dependency Helm Chart and reference the public Helm Chart of Prometheus. As seen below, an empty Chart is created with 1 dependency.
apiVersion: v2
name: prometheus
type: application
version: 1.0.0
appVersion: "1.0.0"
dependencies:
- name: prometheus
  version: 15.6.0
  repository: https://prometheus-community.github.io/helm-charts
Next to the Chart.yaml file, we host the values.yaml file with our overwrites in our Git repository. For now, we only want to add the ArgoCD metric endpoints to our Prometheus configuration YAML file. The deployment of Prometheus is executed via the command:
kubectl config use-context aks-mgt-001
kubectl apply -f https://raw.githubusercontent.com/dewolfs/gitops-argocd-apps/main/application-helm-prometheus.yaml -n argocd
In order to access the Prometheus portal use the following command:
kubectl port-forward svc/prometheus-server -n monitoring 8081:80
http://localhost:8081/
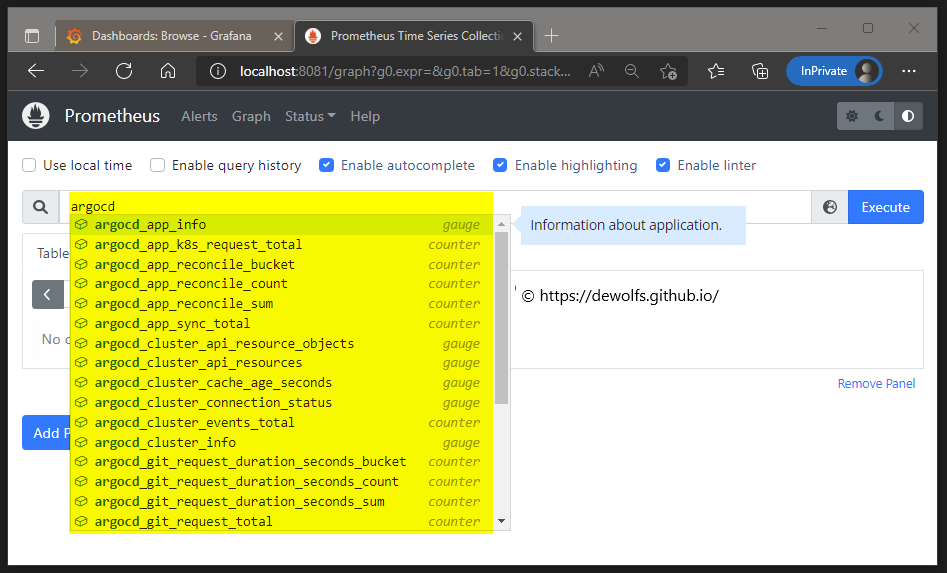
Immediately we can already see that the ArgoCD metrics are being recognized by Prometheus.
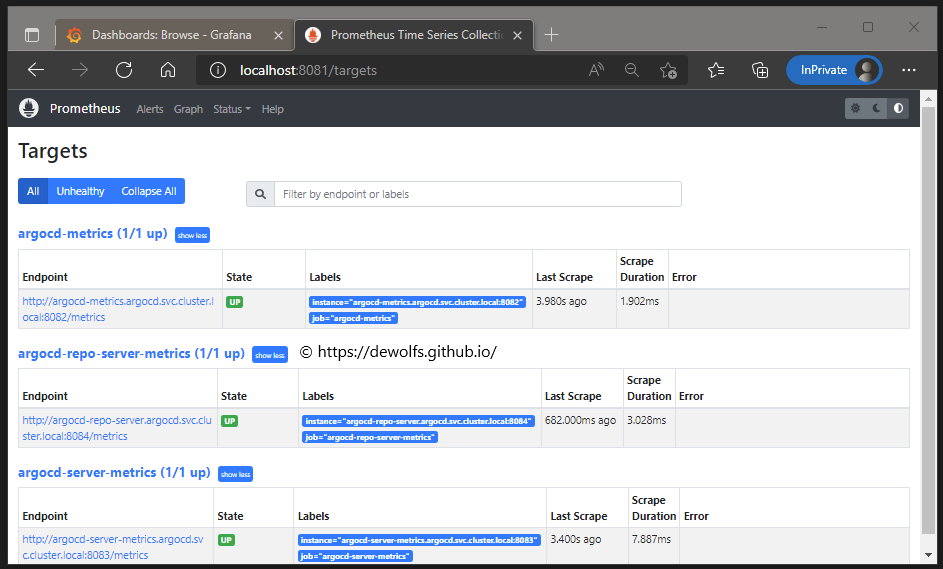
The Prometheus Targets page is showing the configuration which we have defined in our values.yaml file.
4.2 Dashboards
The same logic is applied to install Grafana. We use the public Helm Chart of Grafana and specify an empty dependency Chart.yaml together with a values.yaml file. The values.yaml file contains configuration to:
- connect to the Prometheus datasource
- install the ArgoCD dashboard
kubectl apply -f https://raw.githubusercontent.com/dewolfs/gitops-argocd-apps/main/application-helm-grafana.yaml -n argocd
In order to access the Grafana portal use the following command:
kubectl port-forward svc/grafana -n monitoring 8082:80
http://localhost:8082/

kubectl get secret grafana -n monitoring -o jsonpath="{.data.admin-password}" | base64 --decode
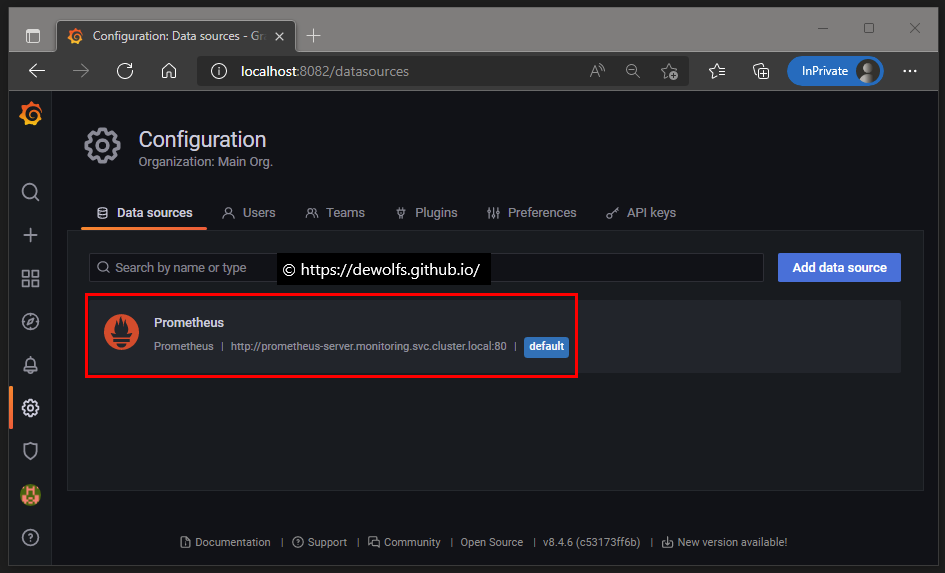
Grafana is connected to our Prometheus datasource:
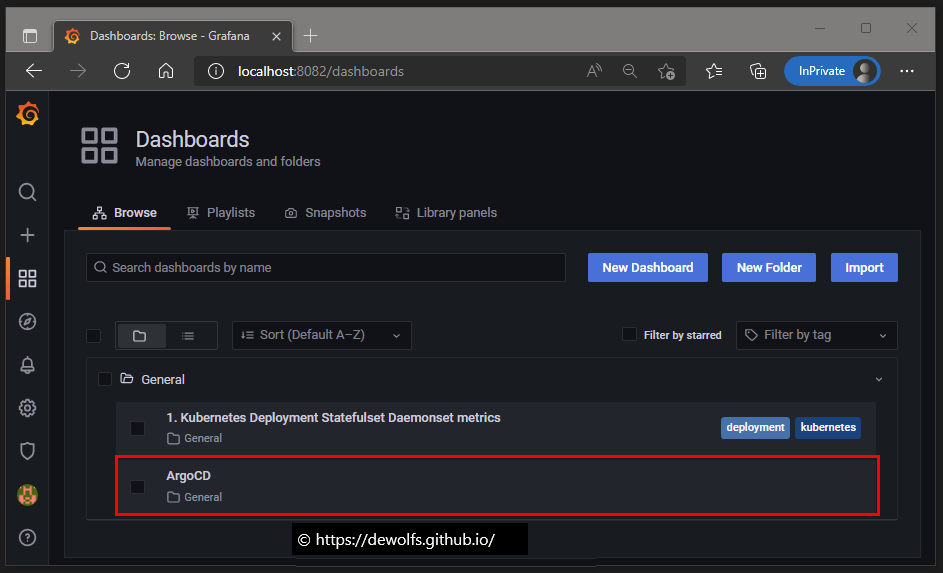
The ArgoCD dashboard has been imported:
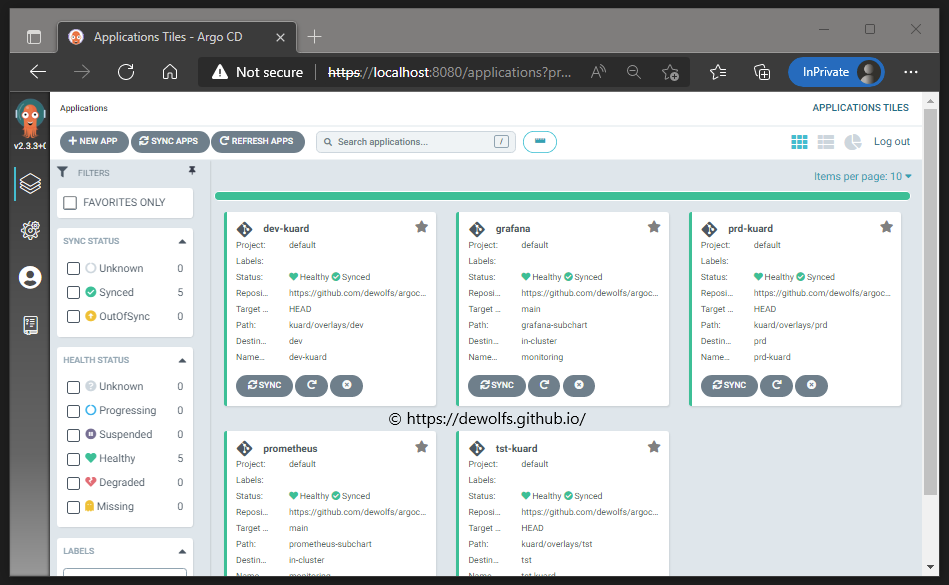
5. Results
When all applications are deployed, you have the following situation in the ArgoCD portal. Take note that Prometheus and Grafana are deployed in our Management (identified as Destination: in-cluster) Kubernetes cluster.
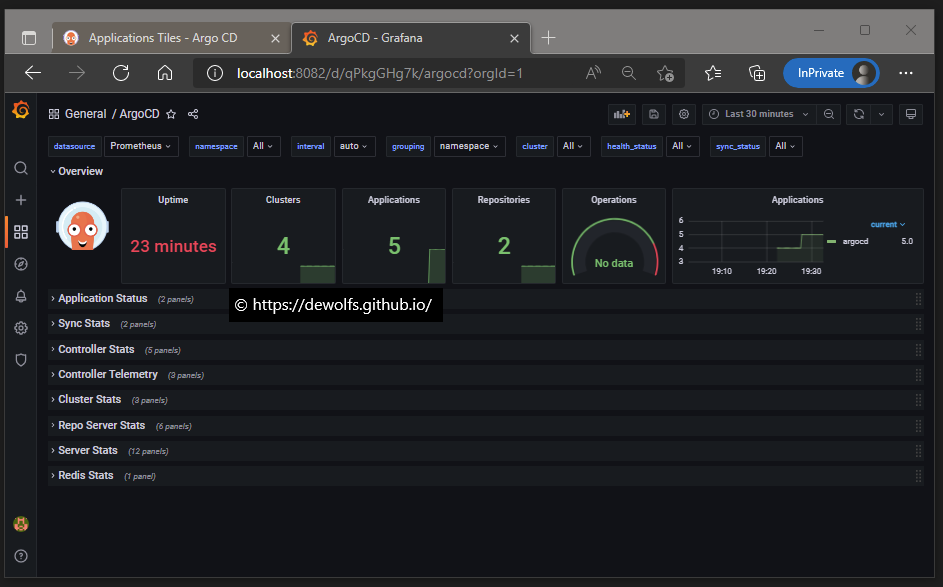
The Grafana dashboard is displaying the metrics of ArgoCD.
The configuration we used in this post can be found on https://github.com/dewolfs/gitops-argocd-infra & https://github.com/dewolfs/gitops-argocd-apps.