
Bootstrap Grafana container with datasource, dashboards and Azure AD AuthN/AuthZ
Monitoring Kubernetes is vitual to understanding the health and performance of a cluster. Grafana is one of the leading open source, feature rich metrics dashboard and graph editors for visualizing Prometheus data.
By checking in the Grafana configuration into our code repository and deploy it to Kubernetes via an automated build system, we ensure consistency across all Kubernetes clusters making for a more productive and reliable experience.
1. Introduction
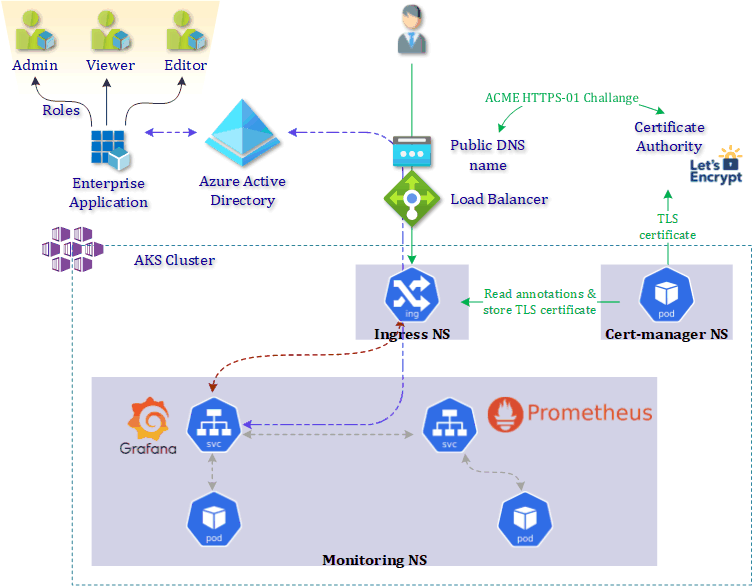
Previously we have deployed Prometheus for monitoring our .NET Core application. Today we will bootstrap Grafana installed via Helm on our Azure Kubernetes cluster. The following configuration will be put into action:
- configure Azure Active Directory as identity provider for Grafana
- setup the Grafana datasource pointing to the Prometheus endpoint
- import existing Grafana dashboards
The image below gives you all the details of what we will implement today.
2. Kubernetes cluster deployment
Before we start with the configuration of Grafana we first need to deploy our Azure Kubernetes cluster. Once all infrastructure is deployed we deploy Grafana and Prometheus. Use the pipeline 1-nginx-cert-manager-pipeline and 2-cluster-grafana-prometheus-pipeline to make this happen.
3. Azure Active Directory identity provider
3.1 Create Azure AD app registration
In order to use Azure Active Directory as identity provider for Grafana we must first create an Azure Active Directory App registration.
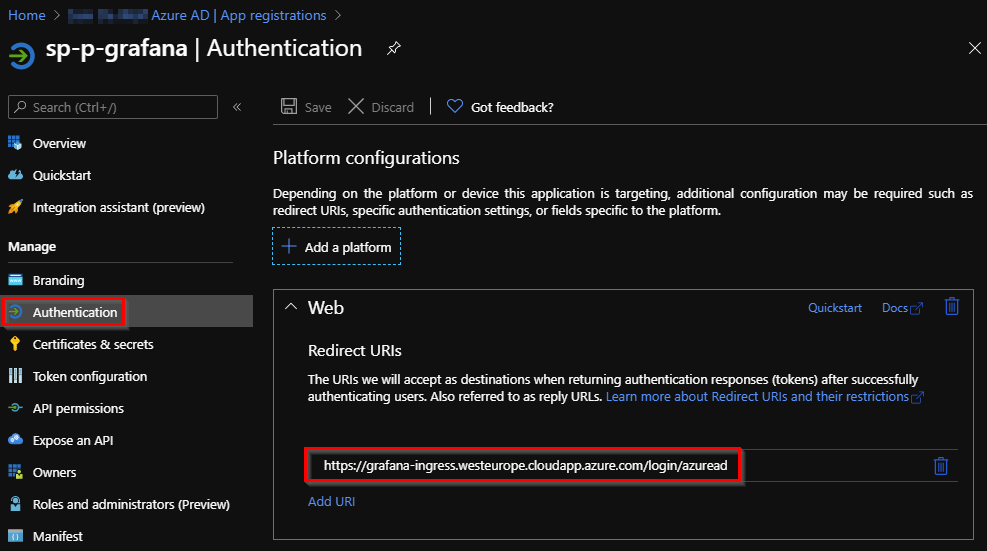
As RedirectURI we specify our public DNS hostname of grafana + /login/azuread. This will allow Azure Active Directory to redirect us once we have successfully authenticated.
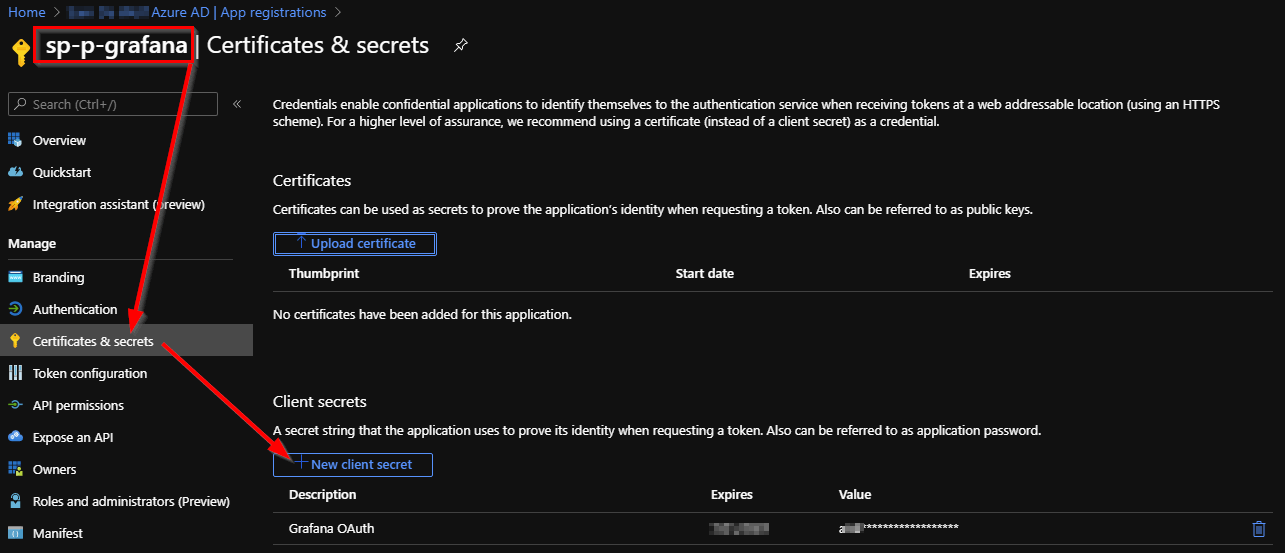
Next, we create a client secret for the Azure AD App registration. Note down the secret because you won’t be able to retrieve it back.
3.2 Azure AD App manifest
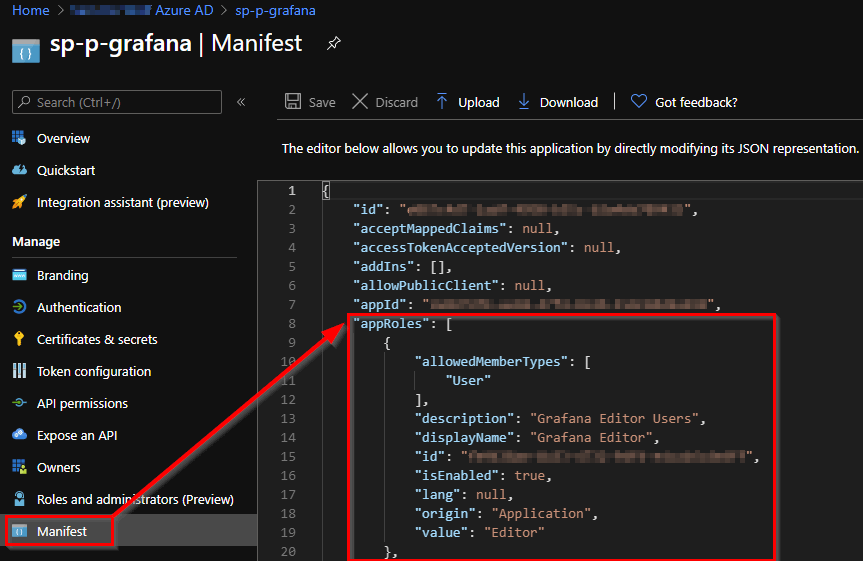
We need to add definitions for the required application roles for Grafana (Viewer, Editor, Admin). Without this configuration all users will be assigned the Viewer role.
Create a unique ID for each role, use uuidgen. You can find an example what to add in the AppRoles array in the code repository monitoring/grafana/approles.yaml
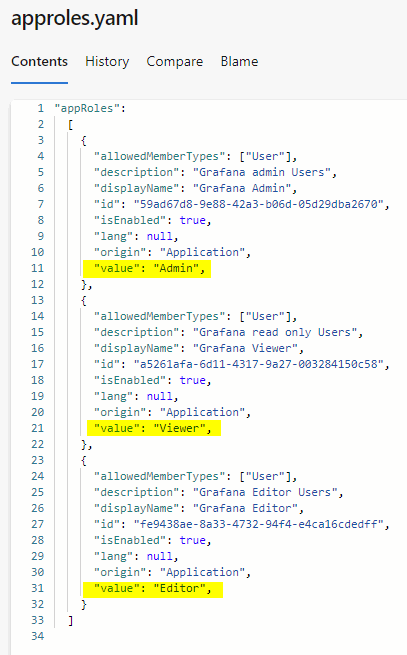
Open the manifest of the Azure AD application and adjust the AppRoles.
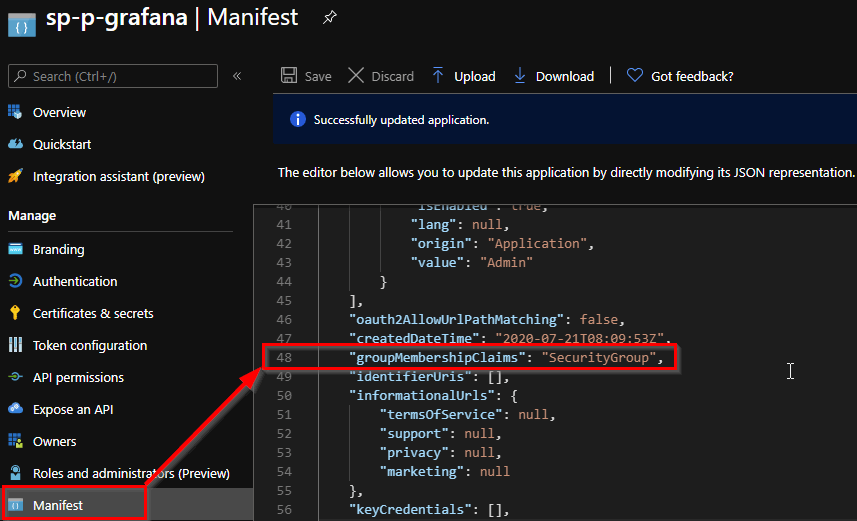
Additionally we define also the groupMembershipClaims to allow SecurityGroup.
3.3 Azure AD App Role assignment
When we login without mapping the application roles to Azure AD roles, we get default “viewer” permissions in Grafana after authentication. As a consequence in the Grafana portal, we won’t have all options available and the Grafana log file contains the following message after login.

We will now assign one of the different application roles (Viewer, Editor, Admin) to one of our Azure AD user/groups.
Open Azure Active Directory > Enterprise applications > search and select your app registration > Assign users and groups. Select one of the application roles and a user/group in your Azure AD Tenant.

When we now login we can see the difference, we assigned ourselves the admin role.

Azure AD Application role assignment is currently not available via the Azure CLI. Upvote the request via this link.
4. Grafana bootstrap configuration
4.1 Azure AD authentication
The deployment of Grafana is executed via a Helm chart. The default configuration of a Helm chart can be overwritten using a values.yaml file. An example can be found in our repository monitoring/grafana/values.yaml
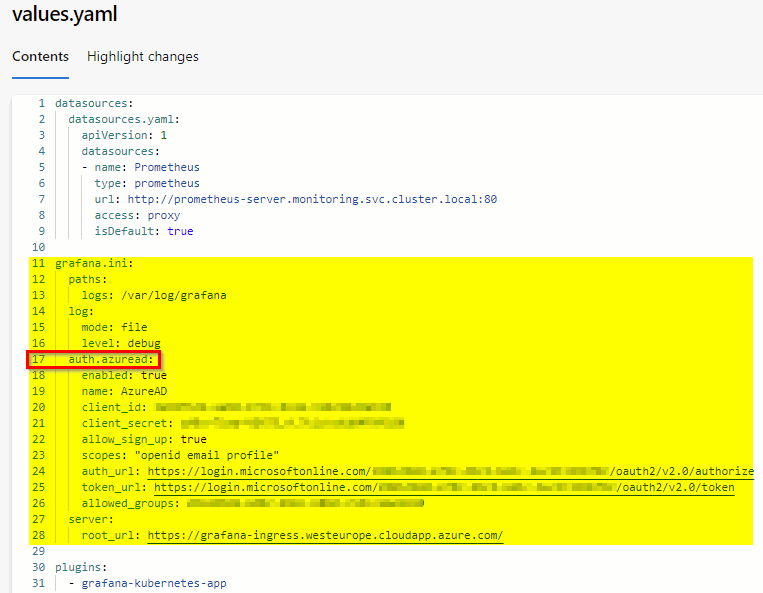
- line 17: Use auth.azuread but make sure you run Grafana version 6.7.0 or newer.
- line 20: Fill in the Azure AD application ID.
- line 21: Fill in the Azure AD client secret.
- line 24: Fill in the Azure AD Tenant Oauth v2 Authorize URL.
- line 25: Fill in the Azure AD Tenant Oauth v2 Token URL.
- line 26: We only allow users that are member of a specific Azure AD group to gain access to Grafana. Fill in the Azure AD group object id.
The Azure AD Tenant Oauth v2 Authorize URL and Token URL can be retreived from the endpoints menu in our the Azure AD App registration.

4.2 Grafana datasource
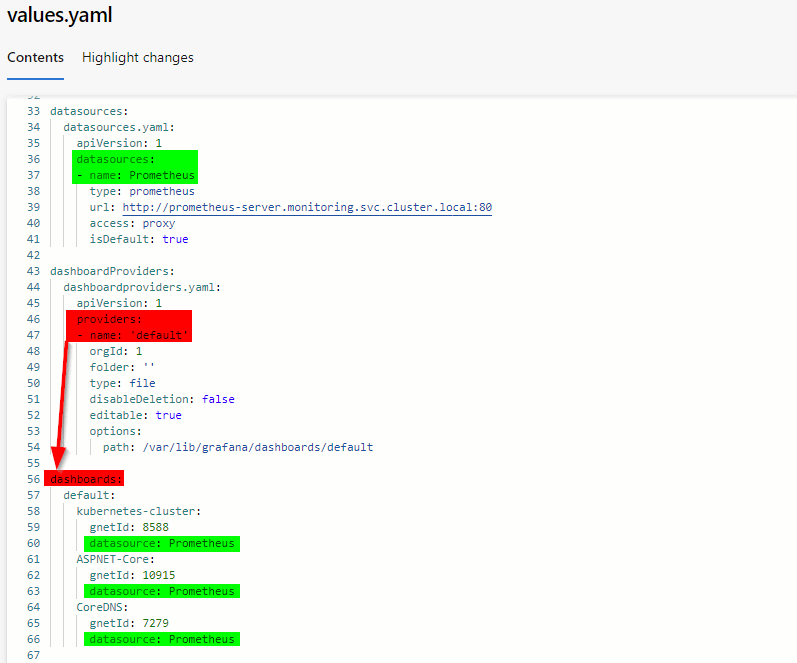
In order to configure the link between Grafana and Prometheus we specify the datasource in the values.yaml file referencing our Kubernetes Prometheus service endpoint.

4.3 Grafana dashboards
Grafana is solely used for visualization of data stored in Prometheus. One of our bootstrap objectives was to add dashboards to the Grafana instance. First we configure a dashboardProvider. Next, we add dashboards to this dashboardProvider and as last step we specify the Prometheus datasource we defined before together with the Grafana dashboard Id.
5. User experience
5.1 Authentication
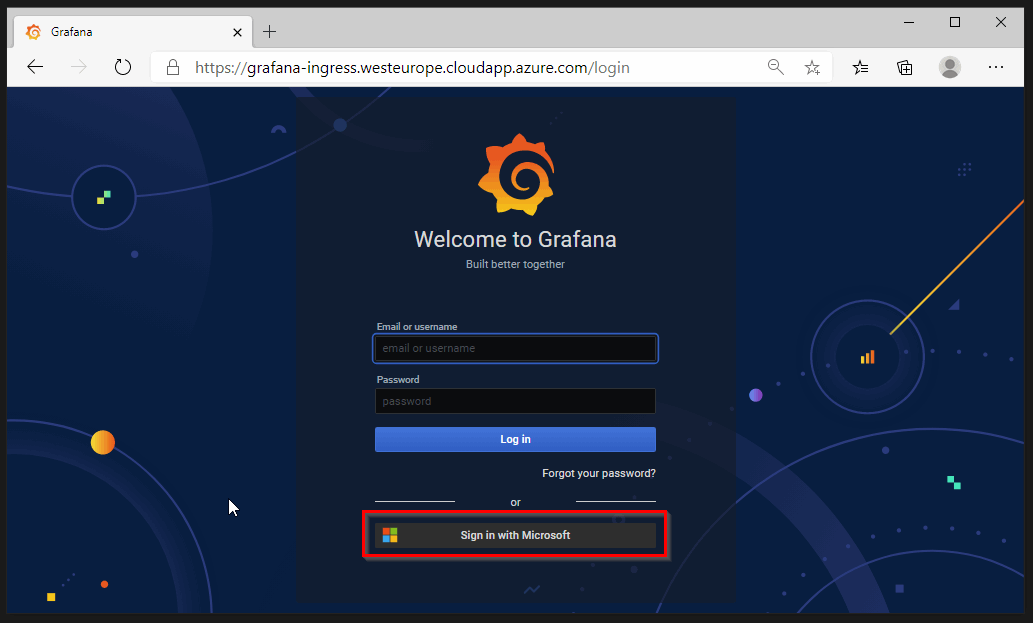
The landing page of Grafana allows us to login via Azure Active Directory.
5.2 Datasource
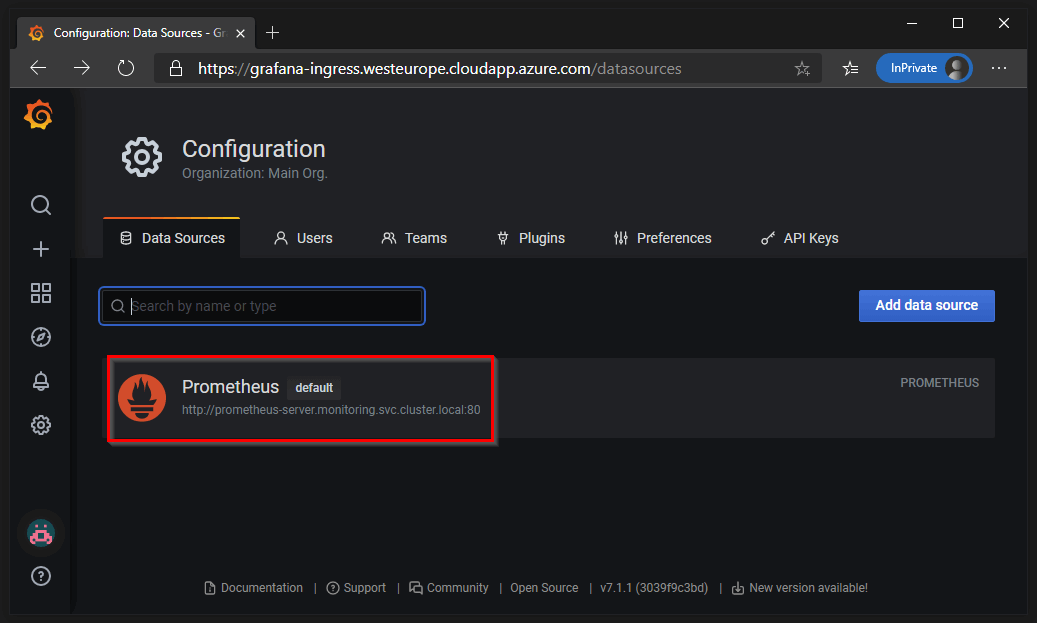
After authentication, we can confirm the datasource to our Prometheus endpoint.
5.3 Dashboards
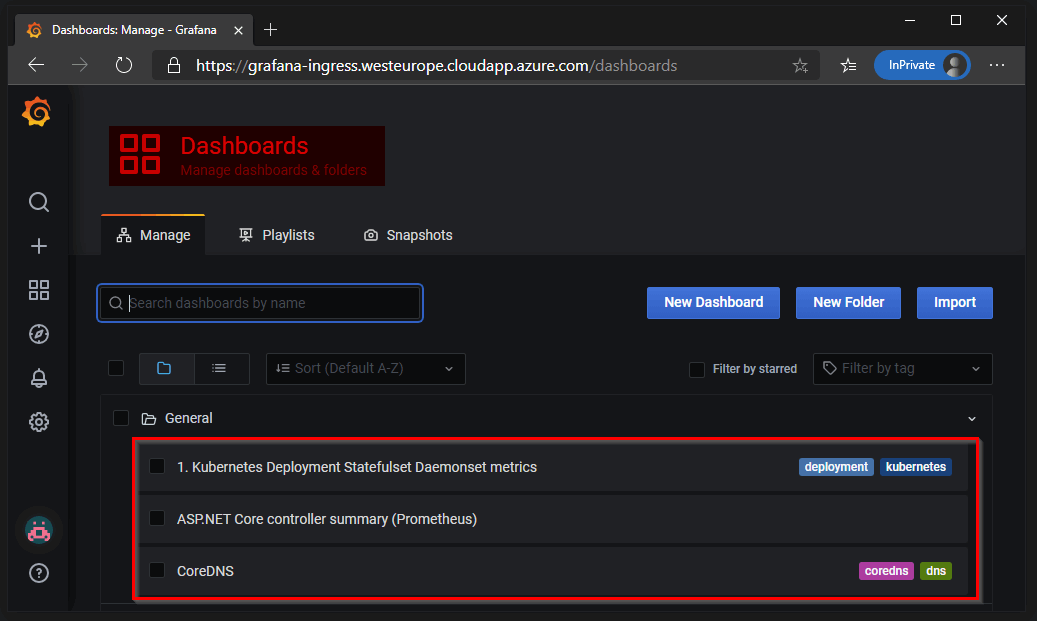
And finally we verify that the dashboards are imported which we had defined in our Helm values file.
The configuration we used in this post can be found on https://github.com/dewolfs/grafana-bootstrap.