
Adopting progressive (canary) delivery with Flagger and service mesh Linkerd on Azure AKS
You might have heard about progressive delivery - it’s an umbrella term for various deployment techniques (eg. Canary releases, Dark launches, A/B testing, Blue-Green mirroring) meant to reduce the risk of introducing new software versions in production.
In this blog post, we will see what it takes to adopt progressive delivery for Kubernetes and how Flagger and service meshes (Linkerd) can make deployments safer. We can use telemetry from the Linkerd service mesh with Flagger to automate deployments of new versions of services in a safe and sane way.
This allows us to safely release new versions of our application and control the traffic depending on the behavior of the application.
1. Introduction
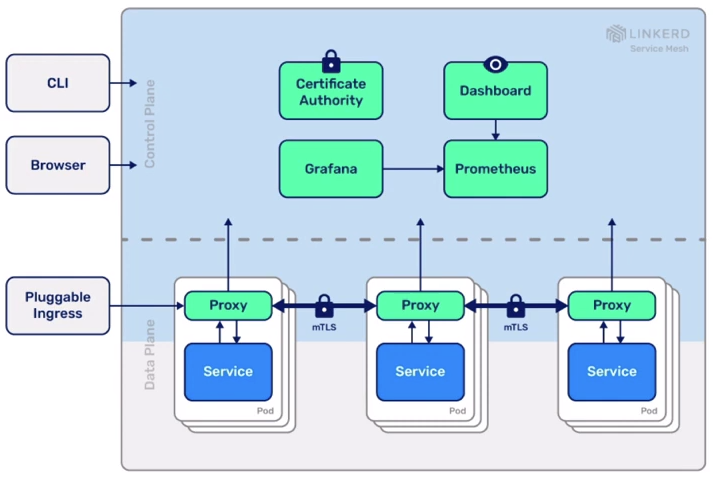
Linkerd is a service mesh for Kubernetes.
It makes running services easier and safer by giving you runtime debugging, observability, reliability, and security—all without requiring any changes to your code.
![]() Linkerd can encrypt and authenticate all TCP connections in the cluster the moment it’s installed, including automatic certification rotation and strong guarantees of pod identity.
Linkerd can encrypt and authenticate all TCP connections in the cluster the moment it’s installed, including automatic certification rotation and strong guarantees of pod identity.
Linkerd works by installing a set of ultralight, transparent proxies next to each service instance. These proxies automatically handle all traffic to and from the service. This design allows Linkerd to measure and manipulate traffic to and from your service without introducing excessive latency.
Linkerd product features:
- Observability: service-level golden metrics: success rates, latencies, throughput. Service topologies
- Reliability: retries, timeouts, load balancing, circuit breaking
- Security: transparent mTLS, cert management and rotation
Flagger is a tool which enhances application rollout capabilities by providing release validation and configurable routing strategies.
![]() Progressive delivery is the next step of CD, enabling service promotion for a subset of users in an automated fashion backed by metrics.
Progressive delivery is the next step of CD, enabling service promotion for a subset of users in an automated fashion backed by metrics.
There’s no one-size-fits-all on what are the appropriate metrics to drive promotions. Often, the four golden signals (latency, traffic, errors, saturation) are used.
Flagger goals:
- Give developers confidence in automating the production releases
- have control over the blast radius
- define the validation process with KPIs and thresholds
- extend the validation with automated testing
- manual gating for critical workloads
- automated rollback
- Make the deployment process observable
- real time feedback
- alerting
2. Install service mesh
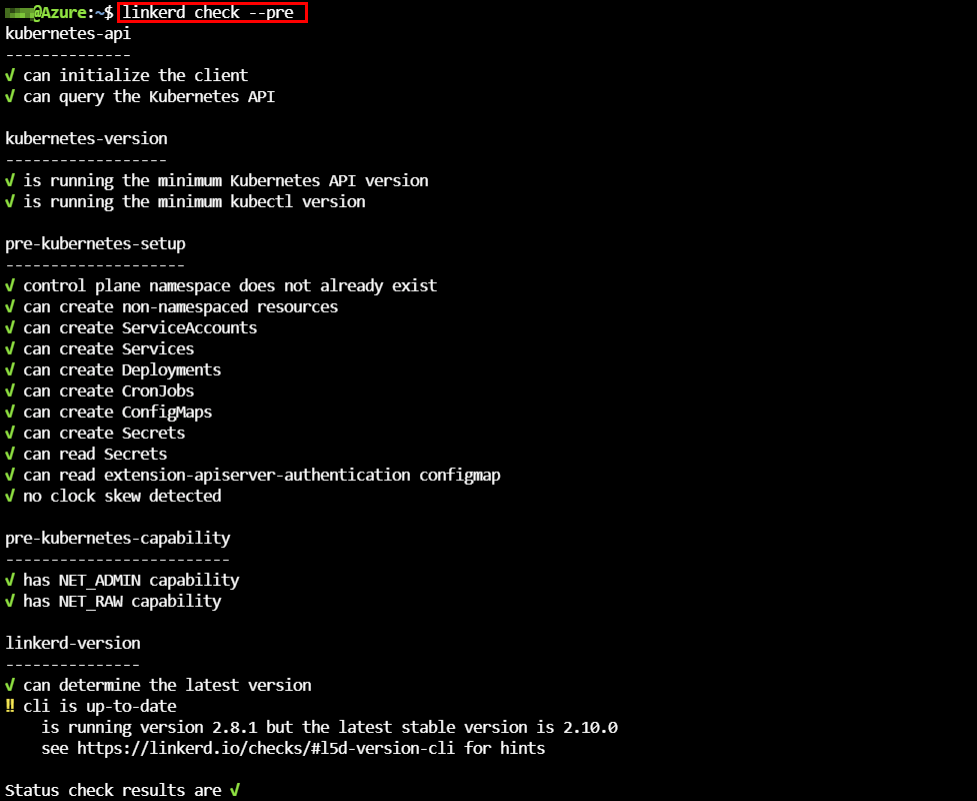
The installation of the service mesh Linkerd is very straight-forward. First the Linkerd binary is downloaded and we run a pre-check (linkerd check –pre) against our target Kubernetes AKS cluster.
Verify the installation of Linkerd with the following commands:
watch kubectl --namespace linkerd get pods
kubectl --namespace linkerd get svc
The Linkerd service mesh installation also provides a nice dashboard with a lot of information. Use Kubernetes port-forwarding to create a secure connection to the relevant pod.
kubectl --namespace linkerd port-forward svc/linkerd-web 8084
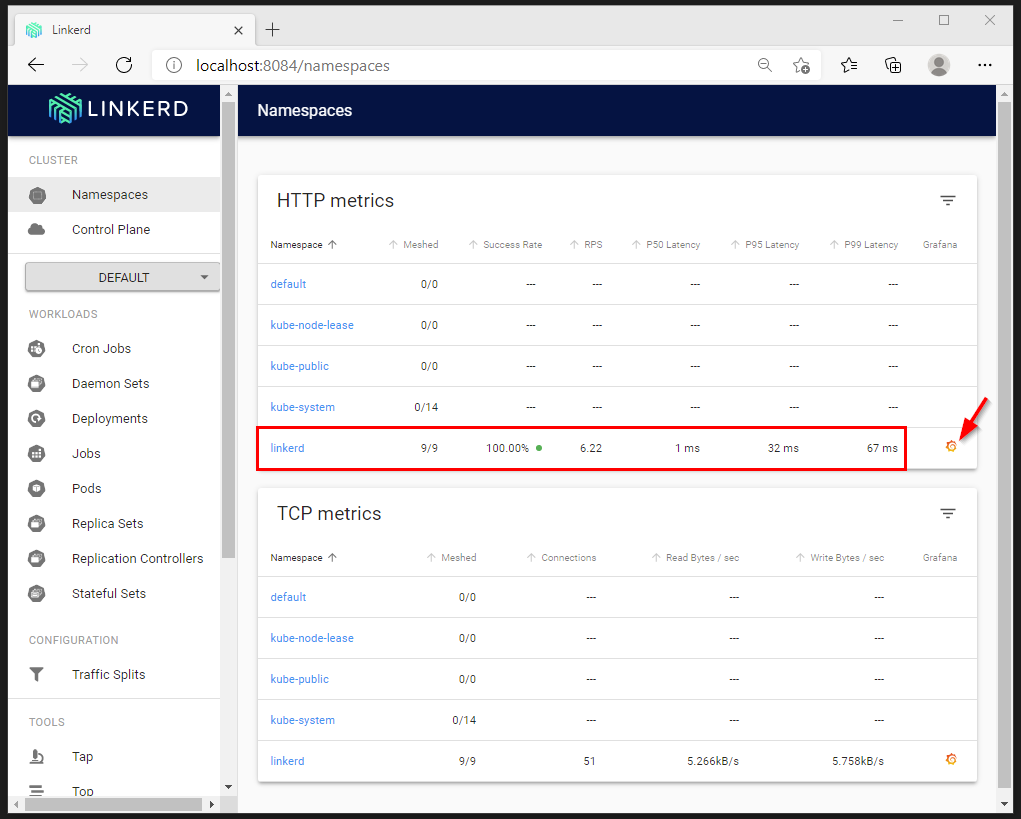
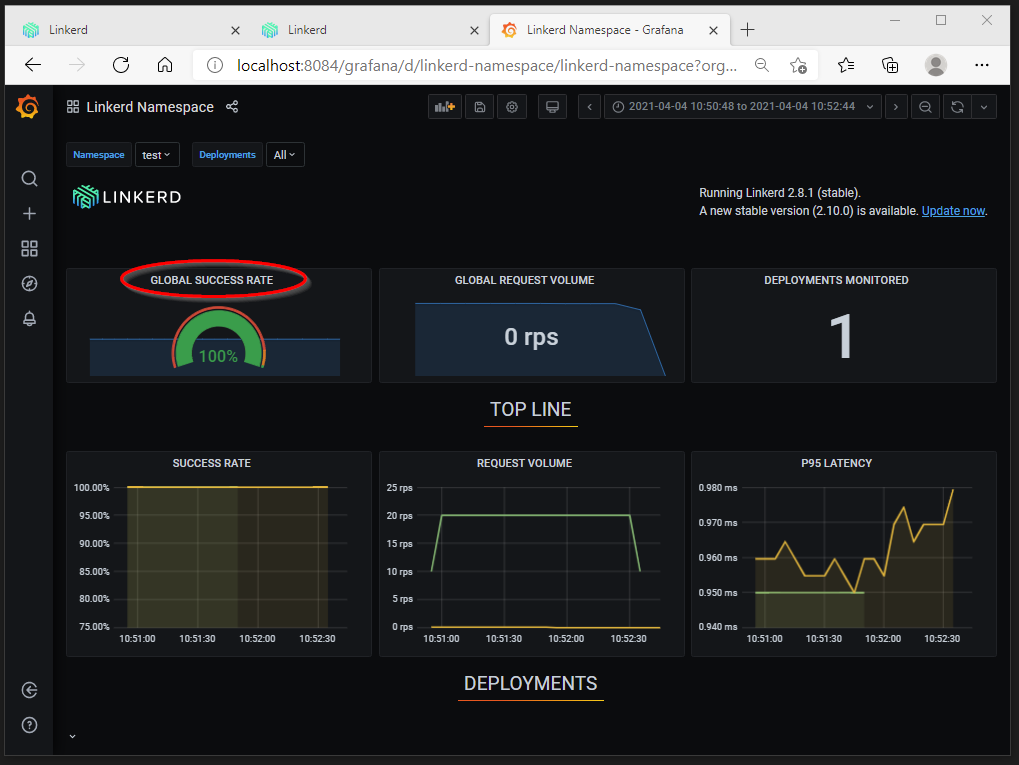
Instantly we can view telemetry data about the Linkerd PODs. Grafana is installed with some dashboards to get in-depth view on the telemetry data.
You can see stats like requests per second (RPS), success rate, latency and more. The Meshed column indicates if the side car proxy is injected or not.
3. Install Flagger
The installation of Flagger is handled by Helm together with some Kubernetes Custom Resource Definitions (CRDs) which extend the standard Kubernetes API. We want to install Flagger in combination with Linkerd so we provide as meshProvider=Linkerd. With the Flagger Helm install we also connect to the already deployed Prometheus instance in the Linkerd namespace.
helm upgrade -i flagger flagger/flagger \
--namespace=linkerd \
--set crd.create=false \
--set meshProvider=linkerd \
--set metricsServer=http://linkerd-prometheus:9090
4. Inject application into Service Mesh
Enabling Linkerd service mesh on your workload is very easy by adding an annotation to your workload namespace. This enables us to activate Service Mesh only on specific namespaces and not the full cluster.
kubectl annotate namespace <namespace-name> linkerd.io/inject=enabled
If your workload is already running inside your Kubernetes cluster, you can inject the Linkerd proxy side car container with the following commands:
kubectl get deployments -n <namespace-name> -o yaml | linkerd inject - | kubectl apply -f -
5. Setup Canary deployment
Via the Flagger Canary CRD we can declarative define the progressive delivery of a new release. The Canary resource defines the deployment that Flagger will control and the parameters for the roll out. In the analysis section of the following resource definition, you can see these parameters. The definition tells Flagger that we want to increase the traffic sent to the canary by 10% when the success rate is 99% or greater.
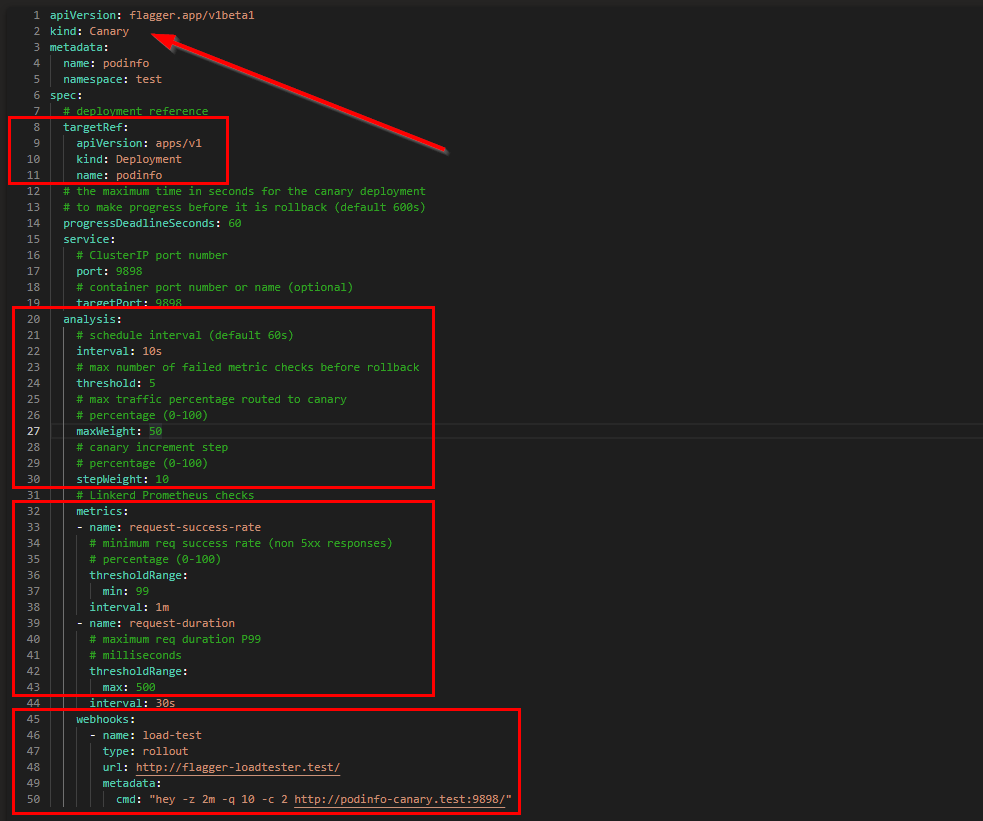
- line 2: We are making use of the new Flagger CRD Canary object
- line 10 & 11: This Canary definition is watching the Kubernetes Deployments of name podinfo
- line 20: The Analysis section defines how long the canary deployment will run, step interval and the error threshold when to rollback
- line 32: The Metrics section contains the definition that the canary is using to make a judgement call about the state of the canary deployment
- line 45: A loadtester is required to instantiate traffic to our deployments
After applying the Canary manifest, we can keep track of all canary definitions in our cluster using the following command:
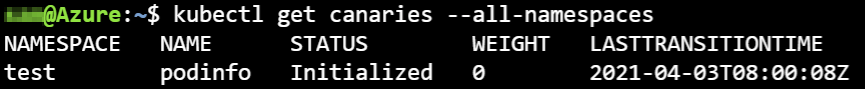
5.1 Activate Canary
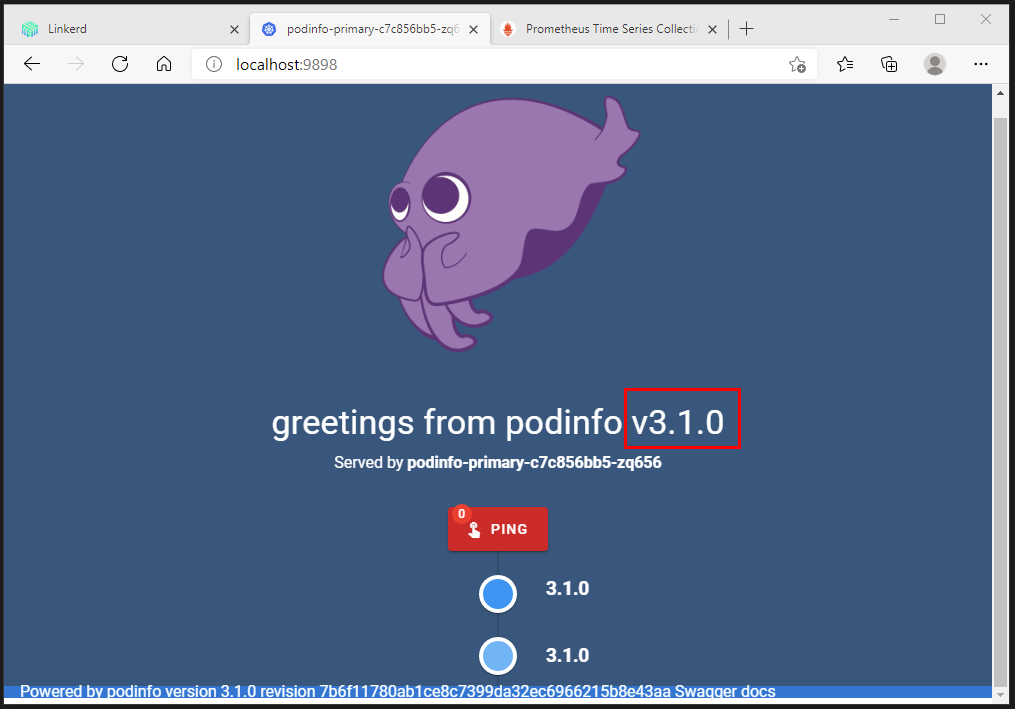
Uptil now, we have our application running and the canary definition is active.
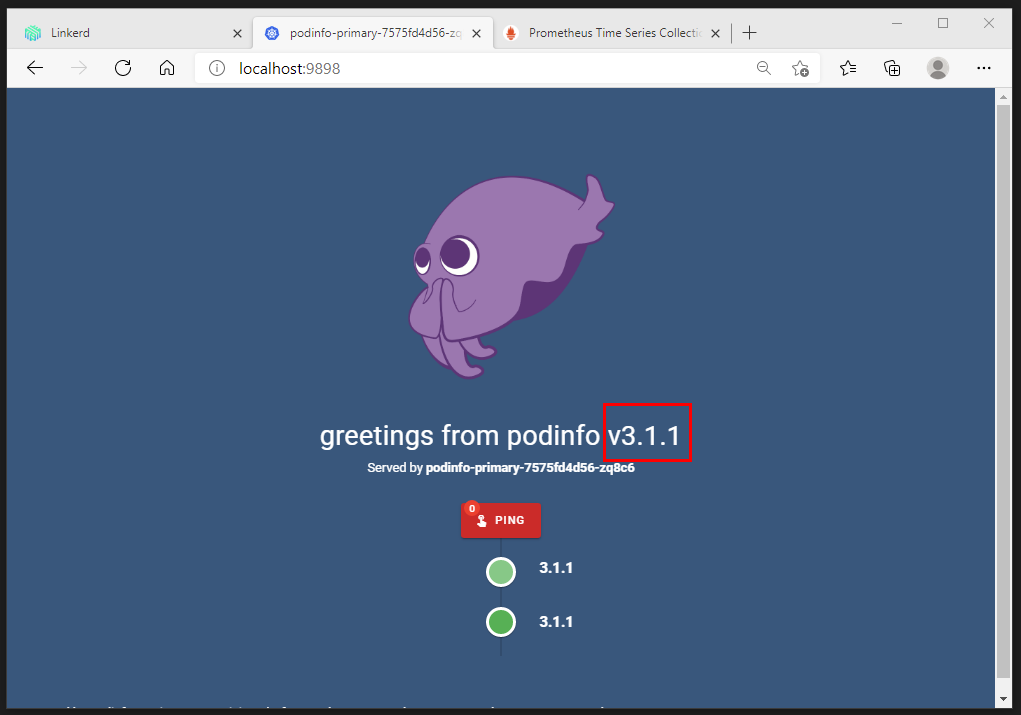
We are using the PodInfo container which gives us a good indication of the version we are running.
Use the following commands to follow the actions executed by Flagger.
watch kubectl get canaries --all-namespaces
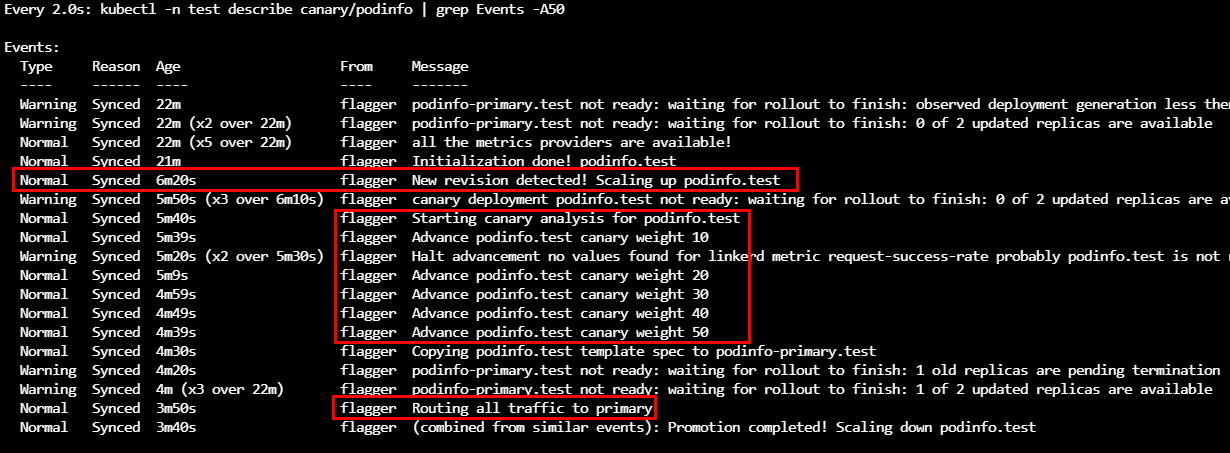
watch 'kubectl -n test describe canary/podinfo | grep Events -A50'
kubectl logs <flagger-pod-name> -n linkerd -f
Now we are going to update our Kubernetes deployment with a new (3.1.1) image version.
kubectl -n test set image deployment/podinfo podinfod=stefanprodan/podinfo:3.1.1
Our Flagger Canary definition is watching changes in the deployment manifest. The image version has been updated so Flagger will kick in, creating an additional deployment with the new PodInfo version, execute the canary (Traffic split) and depending on the success criteria flip over to the new PodInfo version.
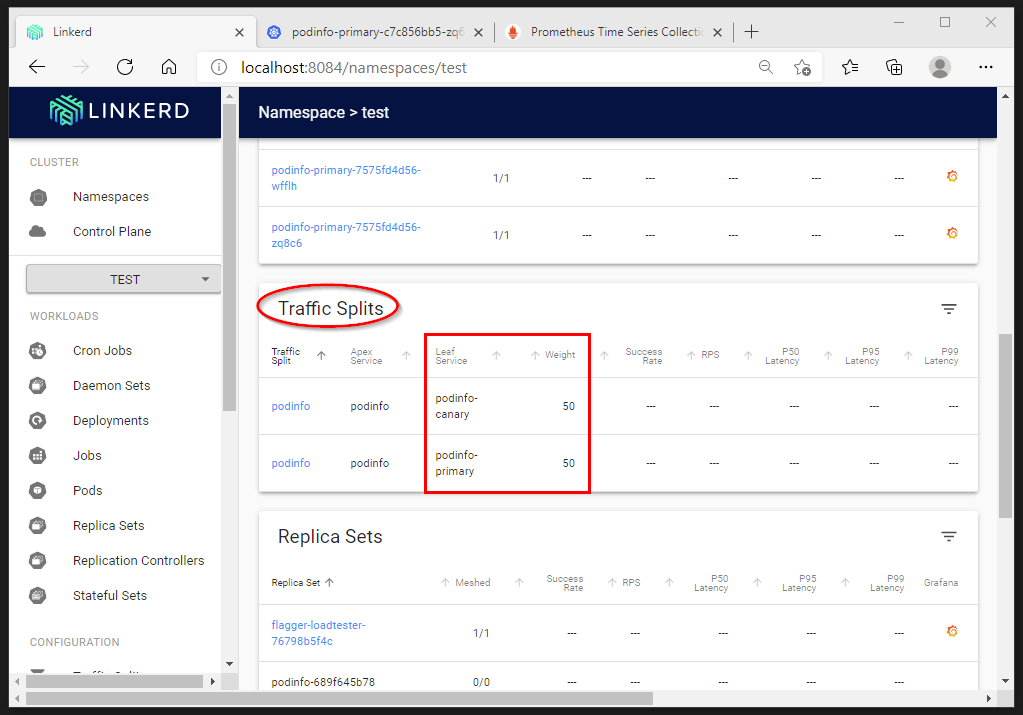
The logs of the Flagger pod indicate clearly the detection of the new version. The canary analysis is initiated uptil 50 with an interval of 10.
Finally all traffic is routed to the primary (=podinfo:3.1.1)
Because the Flagger Canary analysis had a higher success rate of 99%, we now have PodInfo running on the new version.
6. Monitoring
Grafana gets installed together with Linkerd that shows metrics collected by Prometheus such as latency, request volume and success rate.
The configuration we used in this post can be found on https://GitHub.com/dewolfs/linkerd-flagger-aks.